
A Linux server rarely fails out of nowhere. More often, it whispers for hours or days: a service starts restarting “just once,” disk I/O warnings appear intermittently, authentication failures creep up, or a web app begins returning occasional 5xx errors. If those early signs are missed, the whisper becomes downtime.
That’s why experienced administrators treat log monitoring as a core health practice, not an afterthought. Metrics tell you what is trending (CPU, RAM, disk usage). Logs tell you why it’s happening—what actually occurred, in what order, and which component triggered it.
This guide is generic for any Linux distribution (Ubuntu/Debian, RHEL/CentOS/Fedora, Arch, SUSE, etc.). It explains which logs matter most, where to find them, what to look for, and how to monitor them efficiently—without depending on any specific control panel.
What Linux Logs Are (and Why They’re Still the Best “Truth Source”)
Linux logs are records of events generated by the kernel, system services, security components, and applications. Each entry typically includes:
- Timestamp (when it happened)
- Source (kernel, sshd, nginx, systemd, your app, etc.)
- Message (what happened and often a hint of why)
Logs are the closest thing to an objective timeline for incidents. They help you:
- Catch small issues before they become outages
- Detect security threats early (brute force attempts, suspicious sudo use)
- Troubleshoot faster by reconstructing the exact sequence of events
- Verify what changed after deployments, reboots, or configuration updates
Where Linux Logs Live: /var/log and systemd-journald
Most distributions store traditional log files under:
/var/log/
Common examples: syslog, messages, auth.log, secure, kern.log, plus application-specific folders.
On modern systems using systemd, logs are also stored in the journal, which you query with:
journalctl
Depending on the distribution and configuration, you may have both: classic text logs and the journal.
The Essential Log Categories to Monitor
You don’t need to read everything. Focus on the logs that reveal health, stability, and security.
1) System Logs: The First Stop for “What’s Going On?”
These capture general system activity: service starts/stops, background jobs, warnings, and many non-application failures.
Typical locations:
- Debian/Ubuntu:
/var/log/syslog - RHEL/CentOS/Fedora:
/var/log/messages
Quick checks:
tail -n 100 /var/log/syslog
tail -n 100 /var/log/messages
grep -i "error\|failed\|panic\|oom" /var/log/syslog | tail -n 50
Code language: JavaScript (javascript)
Watch for:
- Repeated failures every few seconds (looping services)
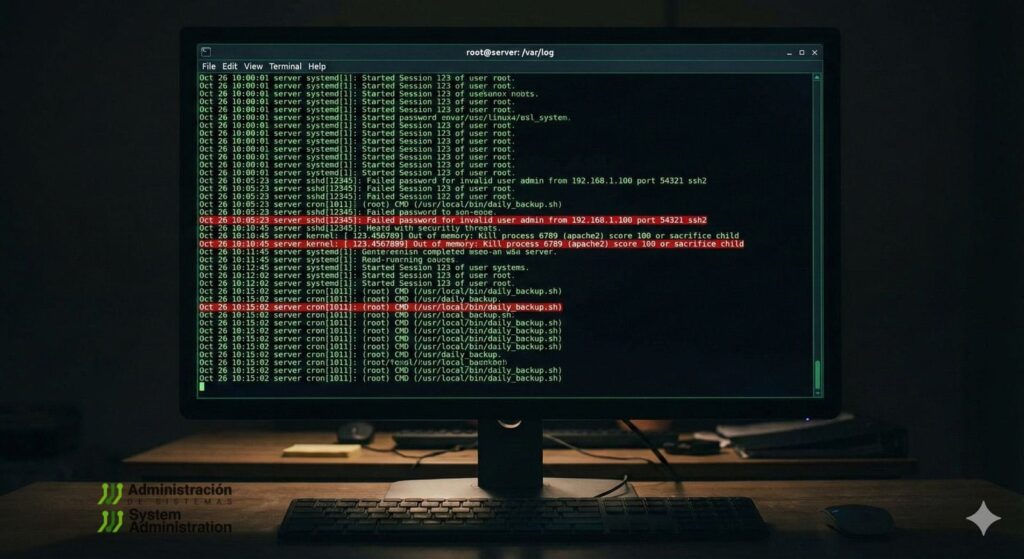
- “Out of memory” / “Killed process” messages (OOM killer events)
- Network timeouts, DNS failures, or interface flaps
2) Authentication Logs: Your Security Pulse
If someone is probing your server, this is where it shows up first.
Typical locations:
- Debian/Ubuntu:
/var/log/auth.log - RHEL/CentOS/Fedora:
/var/log/secure
Common checks:
tail -n 200 /var/log/auth.log
grep -i "failed password" /var/log/auth.log | tail -n 50
grep -i "sudo" /var/log/auth.log | tail -n 50
Code language: JavaScript (javascript)
Watch for:
- Many failed logins from the same IP (brute force)
- Attempts on non-existent users
- Unexpected
sudoactivity outside maintenance windows
3) Kernel Logs: Hardware, Drivers, and “Serious” Failures
Kernel messages can reveal disk problems, memory issues, driver failures, and critical system events.
Where to look:
/var/log/kern.log(some distributions)dmesgoutputjournalctl -k(kernel messages from the journal)
Useful commands:
dmesg -T | tail -n 100
journalctl -k -p warning..alert --no-pager | tail -n 100
Watch for:
- Disk I/O errors, controller resets, filesystem warnings
- Memory errors and allocation failures
- Device resets, PCI errors, repeated driver warnings
4) Service Logs: Why a Daemon Won’t Start (or Keeps Restarting)
On systemd systems, service logs are typically easiest to query via the journal:
systemctl status nginx
journalctl -u nginx --since "today" --no-pager
journalctl -u ssh --since "1 hour ago" --no-pager
Code language: JavaScript (javascript)
Watch for:
- “Start request repeated too quickly” (restart loop)
- Failed dependencies
- Configuration errors after updates or changes
5) Application Logs: Where the Real Causes Usually Live
Applications often explain the “why” better than system logs.
Common examples:
- Nginx:
/var/log/nginx/access.logand/var/log/nginx/error.log - Apache:
/var/log/apache2/error.log(path varies) - Databases: paths vary by engine and config
- Custom apps: often in
/var/log/yourapp/or within the app directory
Typical checks:
tail -n 200 /var/log/nginx/error.log
grep -i " 5[0-9][0-9] " /var/log/nginx/access.log | tail -n 50
grep -i "timeout\|upstream\|refused" /var/log/nginx/error.log | tail -n 100
Code language: JavaScript (javascript)
Watch for:
- Spikes in 5xx responses
- Database connection errors
- Upstream timeouts / refused connections
- Repeated stack traces (bugs or malicious traffic patterns)
The Most Useful Log Commands (Without Overcomplicating It)
For classic log files:
tail -n(recent entries)tail -f(follow in real time)less(scroll large logs safely)grep(filter by keyword/pattern)
Examples:
# Follow system log live
tail -f /var/log/syslog

# Search for critical patterns quickly
grep -i "error\|failed\|denied\|segfault\|panic" /var/log/syslog | tail -n 100
Code language: PHP (php)
For systemd journal:
# Show only errors and higher severity
journalctl -p err..alert --no-pager | tail -n 200

# Logs from this boot
journalctl -b --no-pager | tail -n 200

# Logs from previous boot (great after unexpected reboot)
journalctl -b -1 --no-pager | tail -n 200

# Time window filtering
journalctl --since "2026-01-03 08:00" --until "2026-01-03 10:00" -p warning..alert --no-pager
Code language: PHP (php)
Real-Time Monitoring: The “Change Something, Watch the Logs” Habit
When you restart a service, adjust a config, or deploy an update, real-time log streaming is the fastest way to see whether the system is healthy.
tail -f /var/log/syslog
tail -f /var/log/nginx/error.log
journalctl -u nginx -f
Code language: JavaScript (javascript)
This is especially useful to confirm:
- whether a service starts cleanly
- whether new errors appear immediately
- whether permissions or dependencies are broken
What to Flag Immediately: Common Warning Patterns
These are signals that deserve urgent attention:
- Repeated errors every few seconds/minutes (a persistent failure)
- “Permission denied” (permissions, SELinux/AppArmor, ownership issues)
- Disk space warnings and “no space left on device”
- Service failure loops (“repeated too quickly”)
- Authentication failures spikes (brute-force or credential stuffing)
- OOM killer messages (memory pressure causing process deaths)
- I/O errors (potential disk, controller, or filesystem trouble)
A single instance can be noise. A recurring pattern is usually a real problem.
Best Practices: Staying Proactive Instead of “Reading Logs Only When It’s Burning”
1) Make sure logs don’t fill your disk
Log growth can cause downtime if /var fills. Ensure rotation is configured:
- Classic logs:
logrotate - Journal:
journaldlimits and retention settings
2) Watch trends, not just incidents
The goal is to spot early warnings:
- increasing timeouts
- slowly rising auth failures
- intermittent I/O warnings
- services that “occasionally” restart
3) Separate operations from security review
Operational health: system + service + application logs
Security health: auth logs, firewall logs, sudo activity, SSH anomalies
4) Centralize logs when you have more than one server
Once you manage multiple hosts, manual SSH log checks don’t scale. Centralization enables:
- unified search
- cross-host correlation
- long-term retention and auditing
- alerts based on patterns
(You don’t need a specific vendor to adopt the concept. The key is central visibility.)
The Bottom Line
A stable Linux system is rarely the result of luck. It’s the result of routine visibility. Logs provide the clearest narrative of what the server is doing—what changed, what failed, and what’s quietly deteriorating.
If the habit becomes “check the right logs daily, follow them live during changes, and investigate recurring patterns,” most outages stop being surprises. They become problems you saw coming.
FAQs
Which Linux logs are most important for system health monitoring?
System logs (syslog/messages), authentication logs (auth.log/secure), kernel logs (dmesg/journalctl -k), service logs (via journalctl -u), and the core application logs (web, database, your app).
How often should logs be checked on a production server?
Daily is a strong baseline for production, especially for auth and service errors. High-traffic systems benefit from near-real-time monitoring and alerting on recurring patterns.
How can I quickly see errors for a specific service on systemd systems?
Use journalctl -u <service> -p err..alert --since "today" --no-pager to filter to errors and critical entries.
What’s the safest way to run a legacy app that requires older Linux components?
Isolate the environment, minimize exposure, keep tight access control, and centralize logs so anomalies are visible. When possible, run legacy components in containers or VMs to reduce blast radius.