
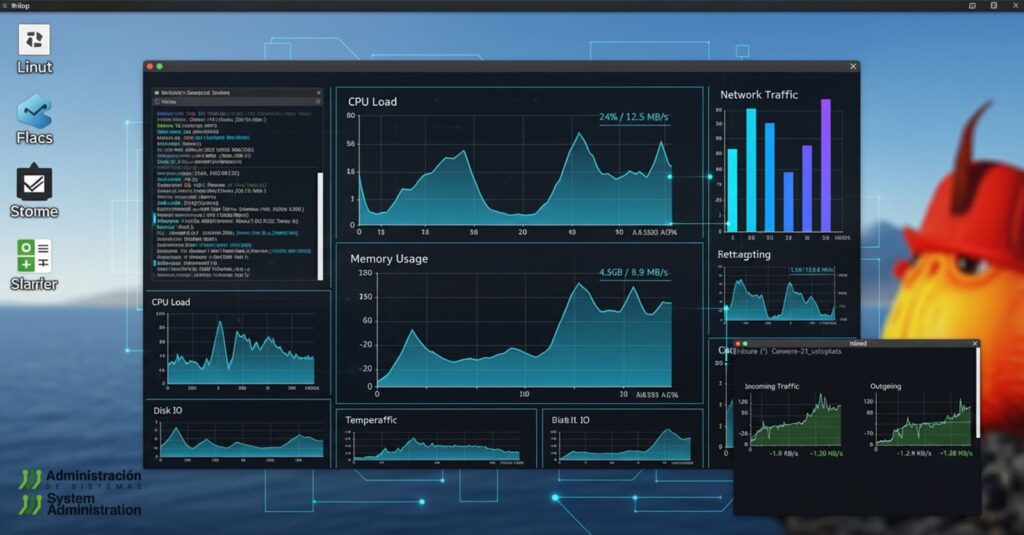
Network traffic monitoring is one of the most common tasks in the daily life of any system administrator. In Linux environments, there are multiple tools to obtain real-time metrics or historical statistics of network usage. Among the most popular are nload, iftop, bmon and vnstat — all lightweight, terminal-based, and very useful on headless servers.
This article provides a technical comparison of their features, installation instructions for the main Linux distributions, and some practical tips to make the most of each tool.
1. nload
Key Features
- ncurses-based interface.
- Displays incoming and outgoing traffic in separate graphs.
- Shows statistics for current, average, minimum, maximum and total transferred traffic.
- Lightweight and very easy to use.
- Does not break down traffic by connections or processes.
Installation
- Debian/Ubuntu:
sudo apt install nload -y - CentOS/RHEL/AlmaLinux/Rocky Linux:
sudo dnf install epel-release -y sudo dnf install nload -y - Arch/Manjaro:
sudo pacman -S nload - openSUSE:
sudo zypper install nload
Tips
nload -m: display all interfaces at once.nload -u M: change units to MB/s instead of Kbit/s.
2. iftop
Key Features
- Similar to top, but for network traffic.
- Breaks down active connections (IP to IP) in real time.
- Shows current, average and cumulative bandwidth per connection.
- Useful for detecting which IPs or services consume the most bandwidth.
- Does not store historical data.
Installation
- Debian/Ubuntu:
sudo apt install iftop -y - CentOS/RHEL:
sudo dnf install epel-release -y sudo dnf install iftop -y - Arch/Manjaro:
sudo pacman -S iftop - openSUSE:
sudo zypper install iftop
Tips
sudo iftop -i eth0: monitor only the specified interface.t: switch between different time scales.p: pause the screen for detailed analysis.
3. bmon (Bandwidth Monitor)
Key Features
- Real-time bandwidth monitor.
- Text-based interface, similar to nload but more configurable.
- Breaks down traffic by interface and protocol.
- Can export statistics in multiple formats (JSON, XML).
- Lightweight, designed for production systems.
Installation
- Debian/Ubuntu:
sudo apt install bmon -y - CentOS/RHEL (EPEL):
sudo dnf install epel-release -y sudo dnf install bmon -y - Arch/Manjaro:
sudo pacman -S bmon - openSUSE:
sudo zypper install bmon
Tips
bmon -p eth0: monitor a specific interface.bmon -o ascii: output numeric-only data without graphs.bmon -o format:json: export data to JSON for integration with scripts.
4. vnstat
Key Features
- Unlike the others, not real-time: it is a historical monitor.
- Stores bandwidth usage statistics per hour, day, month and year.
- Extremely lightweight (runs as a background daemon with negligible resource use).
- Perfect for generating long-term traffic reports.
- Can be integrated with vnstat-dumpdb or frontends like vnstat-php.
Installation
- Debian/Ubuntu:
sudo apt install vnstat -y - CentOS/RHEL:
sudo dnf install epel-release -y sudo dnf install vnstat -y - Arch/Manjaro:
sudo pacman -S vnstat - openSUSE:
sudo zypper install vnstat
Tips
- Start the service:
sudo systemctl enable vnstat --now - Show daily usage:
vnstat -d - Show monthly usage:
vnstat -m - Export to CSV:
vnstat --dumpdb > traffic.csv
Technical Comparison
| Tool | Monitoring type | Real-time | Historical | Graphs | Breakdown by IP/protocol | Resource usage | Best for |
|---|---|---|---|---|---|---|---|
| nload | Aggregated traffic per interface | ✔ | ✘ | ✔ (ncurses) | ✘ | Very low | Quickly check total network traffic |
| iftop | Active IP-to-IP connections | ✔ | ✘ | ✔ (table) | ✔ | Low | Identify IPs/services consuming most bandwidth |
| bmon | Interfaces and protocols | ✔ | ✘ | ✔ (ncurses, configurable) | ✔ | Low | Detailed monitoring with exportable data |
| vnstat | Hour/day/month statistics | ✘ | ✔ | ✔ (text/simple graphs) | ✘ | Very low | Long-term traffic reports |
Conclusion
- If you need to quickly check total bandwidth usage, go with nload.
- If you want to detect which IP or process is consuming the most, use iftop.
- For real-time exportable reports, bmon is the right choice.
- If your priority is storing historical statistics, vnstat is indispensable.
In many cases, the best strategy is to combine them: for example, use vnstat for historical analysis, nload for quick checks, and iftop for diagnosing suspicious traffic.
Frequently Asked Questions (FAQ)
Can I install all these tools on the same server?
Yes. They do not conflict and their resource usage is minimal. In fact, combining them is recommended.
Which tool is best for detecting suspicious connections?
iftop, because it shows live traffic broken down by IP and port.
How can I monitor multiple interfaces at once?
Use nload -m or bmon, both of which support multi-interface views.
Does vnstat retain data after a reboot?
Yes. Data is stored in a lightweight on-disk database, so statistics persist across reboots.