
What is Updo?
Updo is a CLI tool (licensed under MIT) for monitoring uptime and performance of websites and HTTP/HTTPS APIs. It can check multiple targets at once, send requests with headers/POST/JSON, verify SSL certificates (expiry), trigger alerts (webhooks/desktop), export metrics to Prometheus, and, if you want worldwide coverage, run in AWS Lambdas across 13 regions to measure from where your users are.
Key strengths
- Everything from the terminal (interactive TUI or simple/JSON output).
- Alerts via webhook (Slack, Discord, your endpoint) or local notifications.
- Prometheus/Grafana: export metrics and use pre-built dashboards.
- Multi-region via AWS Lambda: real latency by geographic zone.
- Flexible: headers, HTTP methods, request body, text assertions, follow redirects, skip SSL verification (if you know what you’re doing).
Installation
macOS (Homebrew), Linux (package managers), Windows (direct download) or Docker. You can also compile from source (Go).
Tip: if you plan to use Prometheus and Lambdas, install Updo on a machine/VM with Docker to quickly spin up the sample Grafana stack.
Getting started
Basic monitoring
./updo monitor https://example.com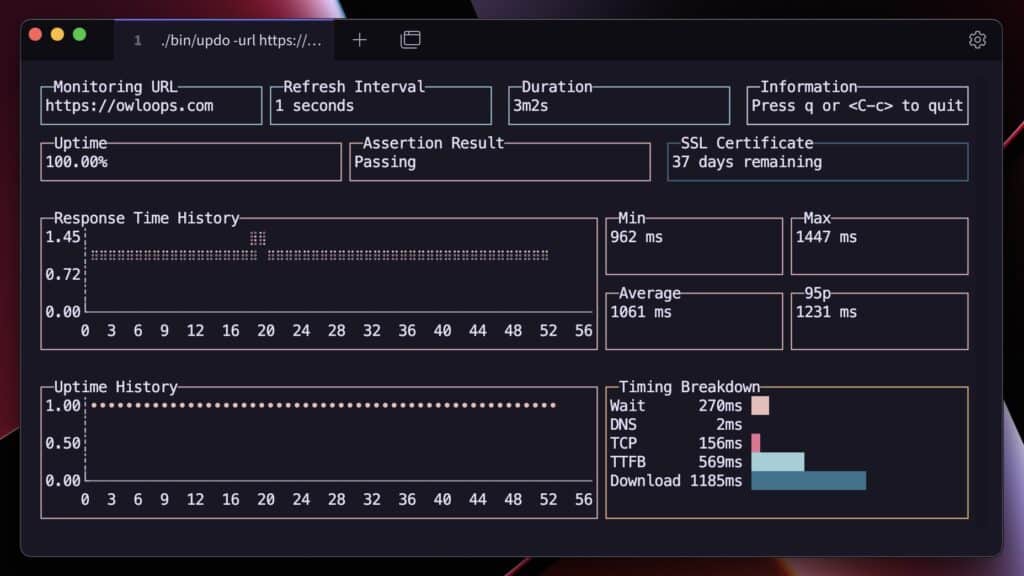
Code language: JavaScript (javascript)- By default refreshes every 5 s, timeout 10 s.
- TUI interface showing latency, HTTP status, uptime, etc.
Adjusting intervals and outputs
# Interval and timeout
./updo monitor --refresh 10 --timeout 5 https://example.com

# Simple text mode and number of iterations (e.g. 10)
./updo monitor --simple --count 10 https://example.com

# Structured JSON logs (ideal for piping)
./updo monitor --log --count 10 https://example.com > output.json
Code language: PHP (php)
Custom requests
# GET with header + content assertion
./updo monitor \
  --header "Authorization: Bearer token" \
  --assert-text "Welcome" \
  https://example.com

# POST JSON to an API
./updo monitor \
  --request POST \
  --header "Content-Type: application/json" \
  --data '{"test":"data"}' \
  https://api.example.com/health
Code language: PHP (php)Assertions: if
--assert-textdoes not appear in the response, the target is considered “down” (useful for detecting logical errors: 200 OK but wrong content).
Multiple targets
From command line
./updo monitor https://google.com https://github.com https://cloudflare.com
Code language: JavaScript (javascript)
With a configuration file (TOML)
For complex setups, use TOML and mix globals with per-target overrides.
example-config.toml
[global]
refresh_interval = 5
timeout = 10
webhook_url = "https://hooks.slack.com/services/YOUR/WEBHOOK"
only = ["Google", "API"]  # filter by name

[[targets]]
url = "https://www.google.com"
name = "Google"
refresh_interval = 3
assert_text = "Google"

[[targets]]
url = "https://api.example.com/health"
name = "API"
method = "POST"
headers = ["Authorization: Bearer token"]
Code language: PHP (php)
Run:
./updo monitor --config example-config.toml
Useful per-target options
method,headers,bodyassert_text,should_fail(expect failure)skip_ssl,follow_redirects,accept_redirectswebhook_url,webhook_headersregions(for AWS multi-region)
Webhook alerts
You’ll receive a JSON payload with state changes (up/down). Example:
{
  "event": "target_down",
  "target": "Critical API",
  "url": "https://api.example.com",
  "timestamp": "2024-01-01T12:00:00Z",
  "response_time_ms": 1500,
  "status_code": 500,
  "error": "Internal Server Error"
}
Code language: JSON / JSON with Comments (json)
Slack (per target)
[[targets]]
url = "https://api.example.com"
name = "Production API"
webhook_url = "https://hooks.slack.com/services/YOUR/WEBHOOK/URL"
Code language: JavaScript (javascript)
Custom webhook with headers
[[targets]]
url = "https://critical-service.example.com"
name = "Critical Service"
webhook_url = "https://alerts.internal.com/webhook"
webhook_headers = [
  "Authorization: Bearer YOUR_TOKEN",
  "X-Service: updo-monitor"
]
Code language: JavaScript (javascript)
Suggestion: implement filters/templates on your receiver to avoid flooding channels with flapping.
Prometheus & Grafana metrics
Updo can send metrics to Prometheus Remote Write and be visualized in Grafana.
Quick with Docker (sample stack)
git clone https://github.com/Owloops/updo.git
cd updo/examples/prometheus-grafana
docker compose up -d

# Grafana -> http://localhost:3000 (dashboard included)
Code language: PHP (php)
Send metrics from Updo
./updo monitor \
  --prometheus-url http://localhost:9090/api/v1/write \
  https://example.com
Code language: JavaScript (javascript)
Or via environment variables:
export UPDO_PROMETHEUS_RW_SERVER_URL="https://prometheus.example.com/api/v1/write"
export UPDO_PROMETHEUS_USERNAME="admin"
export UPDO_PROMETHEUS_PASSWORD="secret"

./updo monitor https://example.com
Code language: JavaScript (javascript)
Typical metrics
- Uptime per target
- Latencies (DNS, TCP, TTFB, download)
- HTTP status codes and success ratios
- SSL certificate expiry
- Assertion results
With these series you can build simple SLO/SLI (e.g. monthly uptime ≥ 99.9 %, p95 response ≤ 800 ms).
Multi-region monitoring (AWS Lambda)
To measure “from where your users are”, deploy remote executors in Lambdas across regions and let Updo coordinate.
Deployment
# Requires AWS CLI with credentials and permissions (Lambda, IAM, STS)
updo aws deploy --regions us-east-1,eu-west-1
Code language: PHP (php)
Usage
# Run checks from those regions (comparable latencies per zone)
./updo monitor --regions us-east-1,eu-west-1 https://example.com
Code language: PHP (php)
Cleanup
updo aws destroy --regions all
Supported regions (13): us-east-1, us-west-1, us-west-2, eu-west-1, eu-central-1, eu-west-2, ap-southeast-1, ap-southeast-2, ap-northeast-1, ap-northeast-2, ap-south-1, sa-east-1, ca-central-1
Tips
- If you see credential errors:
aws sso login --profile your-profile.- Tag resources and limit IAM roles/policies (least privilege principle).
Logging and automation
JSON logs
# All to a file
./updo monitor --log https://example.com > all.json 2>&1

# Metrics to stdout, errors to stderr
./updo monitor --log https://example.com > metrics.json 2> errors.json

# Example with jq
./updo monitor --log https://example.com | jq 'select(.type=="check") | .response_time_ms'
Code language: PHP (php)
CI/CD idea
- A nightly job runs short checks in JSON mode.
- Push to S3/Blob or Loki (if using grafana/loki) for audit.
- If
event == target_down, trigger a workflow (create issue, notify on-call).
Hotkeys (TUI)
- ↑/↓: Navigate targets
- Enter: Expand/collapse target
- Tab: Expand/collapse all
/: Search (ESC to exit)l: Toggle logs per targetq/ Ctrl+C: Exit
Best practices
- Assertions on critical endpoints (e.g. “status”: “ok”) to detect logical degradations.
- SSL expiry: alert in advance (30/15/7 days).
- Avoid false positives: tune
timeout,refresh_intervaland retries (viacountor pipeline design). - Rateguards: careful with very low
--refreshon third-party APIs. - Multi-region: compare latencies/errors by region before assuming “my app is down”.
- Prometheus: define simple alert rules (target_down X minutes, p95 > threshold, etc.).
Updo vs…?
| Tool | Type | Multi-region (native) | Prometheus | Alerts | Complexity | Notes |
|---|---|---|---|---|---|---|
| Updo (CLI) | CLI/TUI | ✔ (AWS Lambda) | ✔ (RW) | ✔ | Low-Medium | Very flexible from terminal; TOML configs |
| Uptime Kuma | Web self-host | ✖ (agents possible) | Exporter | ✔ | Low | Nice UI, full web panel |
| Blackbox Exporter | Exporter | ✖ (you deploy it) | ✔ | Via Prom | Medium | HTTP/ICMP/TCP probes from Prometheus |
| Healthchecks | SaaS/self | ✖ | ✔ (webhook) | ✔ | Low | More “cron/heartbeat” than synthetic HTTP |
| SaaS (StatusCake, UptimeRobot, etc.) | Service | ✔ (points of presence) | APIs | ✔ | Very low | Pay for simplicity, less control |
If you want zero friction and a dashboard always visible, go Kuma.
If you already live in Prometheus/Grafana, Blackbox.
If you like CLI + flexibility and multi-region without paying SaaS, Updo is a great fit.
Quick troubleshooting
- Certificates: avoid
--skip-sslexcept in controlled tests. - Corporate proxy: export
HTTP_PROXY/HTTPS_PROXYvariables. - Alert flapping: raise
--timeout, add stable assertions, add debounce on your webhook receiver. - AWS credentials: renew session
aws sso login --profile X. - Prometheus RW: check correct URL (
/api/v1/write), auth, and firewalls.
“Pro” TOML template (example)
[global]
refresh_interval = 10
timeout = 8
webhook_url = "https://hooks.slack.com/services/YOUR/WEBHOOK"
follow_redirects = true
accept_redirects = true
regions = ["us-east-1","eu-west-1"]   # remote checks

[[targets]]
name = "Front"
url = "https://www.yoursite.com"
assert_text = "Welcome"
webhook_headers = ["X-Env: prod"]
# override intervals
refresh_interval = 5

[[targets]]
name = "API Login"
url = "https://api.yoursite.com/login"
method = "POST"
headers = ["Content-Type: application/json","Authorization: Bearer ${TOKEN}"]
body = '{"ping":"pong"}'
assert_text = "\"status\":\"ok\""

[[targets]]
name = "Docs"
url = "https://docs.yoursite.com"
skip_ssl = false
Code language: PHP (php)
You can inject secrets via environment variables in your CI/CD and TOML templates.
Conclusion
Updo is a straightforward, extensible, and developer-friendly way to set up real monitoring in minutes: from the terminal, with alerts and metrics, plus the ability to test from around the world using Lambdas. It’s perfect for teams that want control, code, and portability, without sacrificing real charts and alerts.
If you’d like, I can prepare a docker-compose with Updo as a sidecar, Prometheus RW Gateway, and Grafana, plus an Alertmanager example with basic SLO rules—ready to copy/paste.