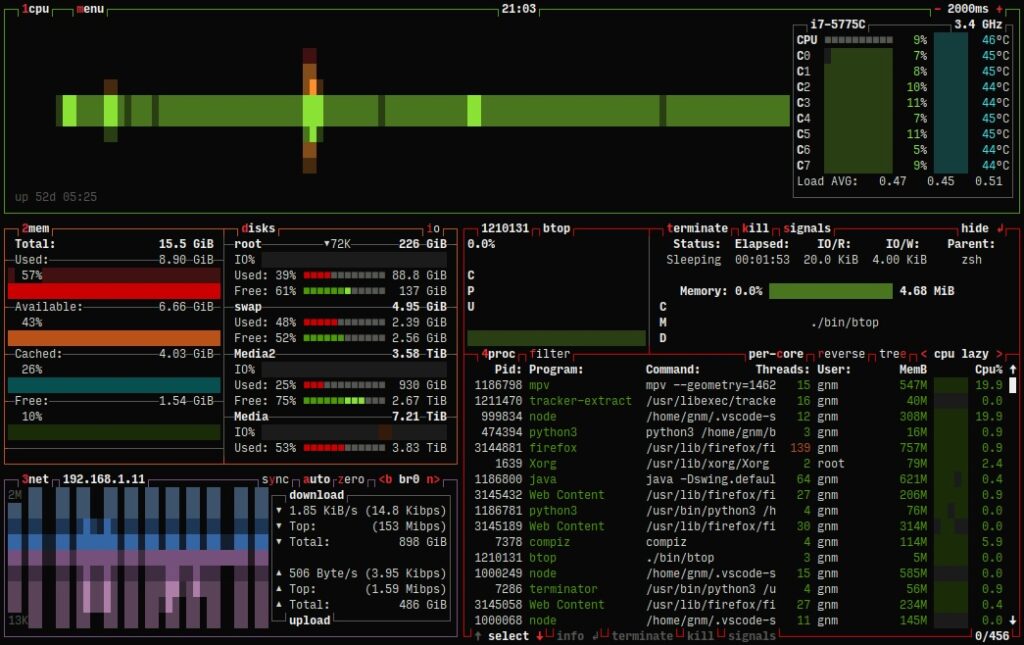
In the vast ecosystem of tools for monitoring system resources, btop stands out as a modern, efficient, and visually appealing solution. Designed as an evolution of earlier tools like bashtop and bpytop, this tool excels not only for its visually attractive interface but also for its ability to provide real-time detailed statistics on CPU, memory, disks, network, and processes. Since its launch, btop has become an essential choice for system administrators and advanced users.
The btop Experience: Design and Functionality
btop distinguishes itself with its clear and user-friendly interface. Unlike traditional resource monitors like top or htop, btop combines an eye-catching design with comprehensive functionality. Its fully interactive interface supports both keyboard and mouse inputs, making navigation easier even for users who are not familiar with command-line tools.
Some of btop’s key features include:
- A detailed view of system processes, including their hierarchical relationship via a process tree.
- Real-time statistics on CPU, memory, disk, and network usage.
- Auto-scaling graphs showing resource usage trends.
- The ability to filter processes based on specific criteria.
- Sending signals (like SIGTERM or SIGKILL) to selected processes directly from the interface.
- Compatibility with multiple operating systems, including Linux, macOS, and FreeBSD.
Recent Innovations
The community behind btop has continuously worked to improve the tool and expand its functionality. In the latest update (version 1.4.0, released in September 2024), Intel GPU support was added, enabling monitoring of utilization, power consumption, and clock speed. Previously, support for NVIDIA and AMD GPUs, as well as for operating systems like OpenBSD and NetBSD, had already been introduced.
These features make btop a versatile choice for both production servers and personal workstations.
Installation and Usage
Installing btop is straightforward, as it is available in the official repositories of several Linux distributions, such as Manjaro (pacman -S btop) and Fedora. It can also be installed via package managers like Homebrew on macOS. For users interested in further customization, btop allows all options to be configured directly through its user interface, eliminating the need to manually edit configuration files.
Operating btop is intuitive, thanks to its keyboard shortcuts that provide quick access to various functions. For example:
- F1: Display the help screen.
- F2: Open the options menu.
- Esc: Return to the main menu.
- Enter: View details of a selected process.
- Ctrl+C: Exit the application.
These features make btop accessible to users with varying levels of expertise.
Beyond Monitoring: Moving Towards Observability
While tools like btop offer a general overview of system resources, more advanced solutions may be required in critical environments. This is where Application Performance Monitoring (APM) comes into play, providing in-depth analysis of how code impacts system resources and the end-user experience.
Integrating btop with observability solutions can provide a more comprehensive view of application and system performance, helping to identify bottlenecks and optimize both software and hardware.
Conclusion
btop represents the perfect balance between functionality and design in the realm of resource monitoring. Its ability to deliver detailed information in a visually appealing manner makes it an indispensable tool for any system administrator or advanced user. With an active community driving continuous improvements, btop remains a modern and efficient alternative to traditional tools.
For those seeking a lightweight, powerful, and adaptable solution, btop is undoubtedly one of the best options available today.

