
As Claude Code becomes more embedded in day-to-day engineering work, a different kind of question keeps popping up — not “can it do it?”, but “what is it really costing us?” Even on flat-rate plans where the bill doesn’t change line by line, teams still want visibility: which days spiked, which sessions ran long, and which models were doing the heavy lifting.
That’s the gap ccusage (claude-code-usage) is aiming to fill. It’s a command-line tool that analyzes Claude Code usage from local JSONL files and produces readable reports — daily, weekly, monthly, by session, and even by billing-style time windows. The pitch is refreshingly simple: it doesn’t modify projects or require a cloud dashboard; it reads what’s already on disk and turns it into something you can reason about.
Why usage analytics suddenly matters for coding agents
Once AI assistance becomes iterative — prompts, follow-ups, refinements, tool calls, more refinements — “a chat” stops being a chat and becomes a measurable workload. In practice, that means:
- long debugging sessions can quietly dominate usage,
- certain workflows (tests + refactor loops) create predictable spikes,
- and model choice isn’t just “quality,” it’s a usage pattern.
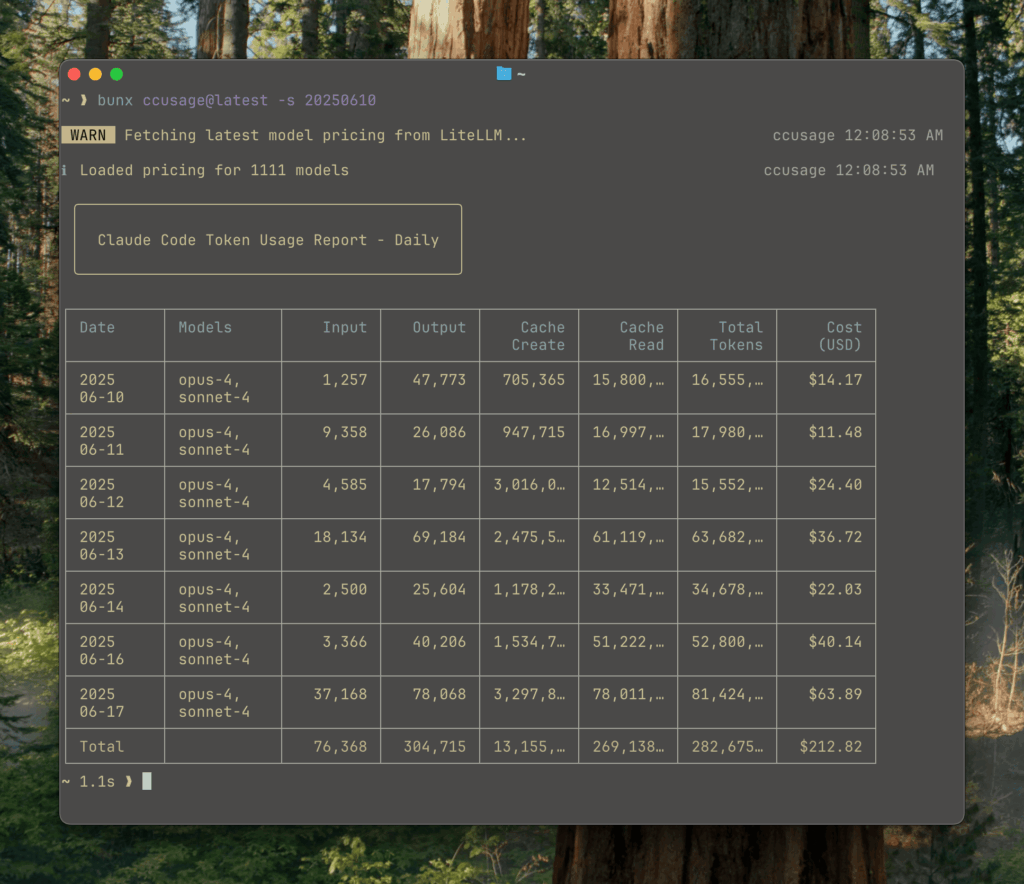
ccusage frames this as a visibility problem: you shouldn’t have to guess where the tokens went. You should be able to see usage aggregated by date, grouped by conversation sessions, and broken down by model family (e.g., Opus vs Sonnet), with estimated costs in USD when that’s useful.
What ccusage actually provides (in plain sysadmin terms)
ccusage behaves like a lightweight “scorecard” for Claude Code usage, built for terminals and automation:
- Daily reports with token totals and cost estimates
- Weekly reports (with configurable week start)
- Monthly reports to spot trends and recurring peaks
- Session reports to identify the most “expensive” conversations
- 5-hour blocks for tracking usage inside Claude-style billing windows
- Model tracking to see which Claude models are being used
- Cache-aware accounting, separating cache creation tokens from cache read tokens
- JSON output for piping into internal dashboards or scripts
- Offline mode, using pre-cached pricing data when you don’t want network calls
- MCP integration, via a built-in Model Context Protocol server for tool workflows
The overall vibe is intentional: minimal friction, readable output, and structured data when you need it.
The detail that trips people up: where the logs live
One practical highlight in the docs is the note that Claude Code’s local data location changed in newer versions. The tool accounts for both the newer path and the older “legacy” path, so you don’t have to manually stitch datasets together.
- Newer location:
~/.config/claude/projects/(Claude Code v1.0.30+) - Older location:
~/.claude/projects/
For anyone managing multiple machines or standardizing dev environments, that small detail matters — it’s often the difference between “no data found” and “oh, it moved.”
A quick look at how it’s used
ccusage is built around the “give me an answer now” terminal workflow. Typical usage looks like:
bunx ccusage daily
bunx ccusage weekly
bunx ccusage session
If you need to feed the results into something else, JSON output is part of the tool’s design rather than an afterthought.
FAQ
What is ccusage, exactly?
A CLI tool that reads Claude Code’s local JSONL usage files and generates reports (daily/weekly/monthly/session/time-block) with model breakdowns and estimated costs.
Does ccusage send my data anywhere?
Its core purpose is offline/local analysis of on-disk usage files, so it’s designed to work without turning your usage telemetry into someone else’s telemetry.
Where does Claude Code store the data ccusage analyzes?
The docs reference both ~/.config/claude/projects/ for newer Claude Code versions and the legacy ~/.claude/projects/ location.
Why would a team care about “5-hour blocks”?
Because long sessions aren’t evenly distributed. Grouping usage into fixed windows helps pinpoint bursts (and the workflows causing them), especially during sustained coding or debugging runs.