
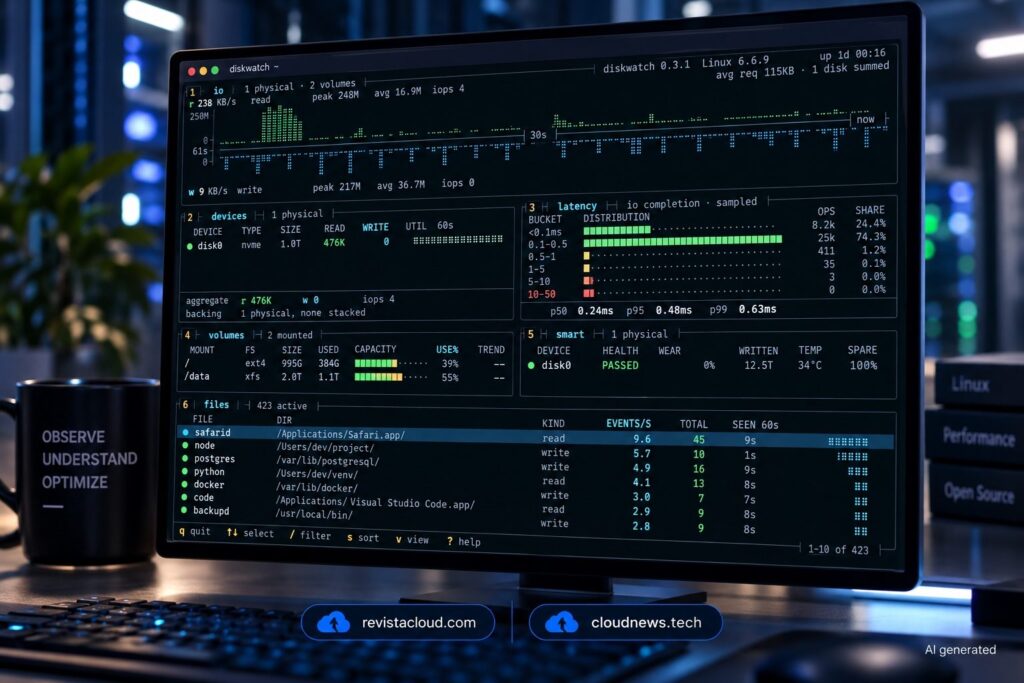
When a disk starts working continuously, figuring out which process is responsible can mean jumping between tools such as iostat, iotop, lsof, df, smartctl, and lsblk. Diskwatch tries to bring that diagnosis into a single terminal interface written in Rust, reading information already exposed by the operating system and correlating file activity, I/O rates, and open file descriptors to identify which processes may be behind the problem. It installs no background agent, maintains no database, and sends no telemetry to an external service.
The key points of Diskwatch in 30 seconds
- Diskwatch is a Rust-based storage diagnostics TUI for Linux and macOS.
- It combines kernel metrics, file activity, and open file descriptors to identify processes associated with heavy disk activity.
- It can run in an 80×24 Lite view designed for SSH sessions and tmux panes.
- There is no daemon, no persistent metrics database, and it operates read-only.
- It also covers devices, volumes, latency, SMART data, capacity, and the busiest files.
The idea starts with a familiar situation for sysadmins: the disk activity light will not stop blinking, load is increasing, or a volume suddenly feels sluggish, but it is not yet clear whether the culprit is a database, logging process, backup job, compiler, or some unexpected task.
Diskwatch is designed to be the tool opened before starting to work through several separate utilities.
The project is a sibling of NetWatch and SysWatch and uses a similar interface and keyboard shortcuts. Its scope is deliberately local: it analyzes a single machine and is not intended to replace fleet observability or persistent monitoring platforms.
Joining /proc, inotify, and open file descriptors to find the culprit
One of Diskwatch’s most interesting features is its Hot Files view.
On Linux, Diskwatch uses inotify to detect active files and combines that information with data from /proc. It can inspect /proc/<pid>/io for per-process I/O rates, while /proc/<pid>/fd reveals which files each process currently has open.
The program correlates these sources.
This distinction matters because inotify itself does not provide the PID responsible for each filesystem event. Diskwatch therefore cannot claim that a particular process performed a specific write simply from an inotify event.
Instead, it infers the relationship.
If a file is seeing heavy activity and a process with a high write rate currently has that file open, Diskwatch can associate the two and display that process as the likely culprit.
The project explicitly documents this limitation. Process attribution is a join between activity information and open file descriptors, not a direct per-event measurement.
That creates two important limitations.
Sampling takes place every two seconds, so a process that opens a file, writes to it, and closes it between samples can be missed. Compilers, short Git operations, and some package-manager activity are particularly likely to fall into this category.
Without elevated privileges, the program can also only access all the information available to the user running it. If other processes belong to different users, some attribution may be incomplete.
Obtaining an exact PID for every event would require mechanisms such as fanotify with FAN_REPORT_PID or eBPF tracing, generally involving higher privileges. Diskwatch deliberately avoids requiring those mechanisms for normal operation.
That trade-off fits its philosophy: quick diagnostics without turning the tool into a permanently privileged agent.
A Lite view that fits inside 80×24
Although Diskwatch provides several screens, one of its most practical modes for remote administrators is Lite:
diskwatch --liteIt is designed to fit into an 80-column by 24-line terminal, a size that remains useful for SSH sessions, compact consoles, and tmux panes.
The view summarizes the essential metrics: reads and writes, capacity, and the busiest files.
Selecting a file and pressing Enter opens an additional detail block showing the process that currently holds the file open. On terminals wider than 99 columns, that information appears directly in a PROCESS column.
For administrators who need more information, there is also Dense mode:
diskwatch --denseThis displays six blocks simultaneously:
| Block | Information |
|---|---|
| IO | Reads, writes, IOPS, utilization, latency, and percentiles |
| Devices | Activity and characteristics per device |
| Latency | Latency histogram |
| Volumes | Capacity and projected time until full |
| SMART | Health, wear, temperature, and host writes |
| Files | Busiest files and associated processes |
The full interface adds eight tabs covering devices, volumes, filesystems, I/O, SMART data, hot files, and detected anomalies.
In practice, Diskwatch tries to collect information that would normally require several separate tools.
Not every percentile is a true per-operation percentile
The project also does something that is not always common among small terminal tools: it documents which metrics are exact and which are approximations.
For example, Diskwatch displays p50 and p99 latency values, but on Linux it does not obtain the latency of every individual block I/O operation through eBPF.
Instead, it samples periodically.
Each 200-millisecond interval calculates an average service time and places the number of operations from that interval into one of seven histogram buckets. This makes it possible to identify sustained periods of slow I/O, but it is not equivalent to measuring a true p99 across every individual operation.
The project states this explicitly.
Obtaining true per-operation percentiles on Linux would require a tracing tool such as the eBPF-based biolatency. macOS has its own limitations because of the metrics exposed by IOKit.
The same applies to device utilization.
Linux exposes the data needed through /proc/diskstats, but macOS does not provide a directly equivalent busy-time counter. Diskwatch therefore displays other metrics rather than inventing a utilization value.
When a metric cannot be measured on a particular platform, Diskwatch displays --.
That distinction matters for a diagnostics TUI. A visually precise number can create a false sense of accuracy when it is actually derived from an approximation.
It also watches capacity, RAID, and SMART
Diskwatch is not limited to finding which process is writing.
On Linux, it obtains device statistics from /proc/diskstats, hardware information from /sys/block, RAID information from /proc/mdstat, and usage data from mounted filesystems.
It can display device models, serial numbers, firmware versions, read and write rates, operations per second, requests in flight, and utilization.
For SMART information it uses smartctl when available. Without that optional dependency it can still provide more basic health information, but not the complete SMART attribute tables.
On macOS it relies on tools already available in the operating system, including ioreg, diskutil, and system_profiler.
Diskwatch also estimates how long it will take for a volume to become full. It observes capacity growth over a ten-minute window and projects the current trend. If a volume is stable or shrinking, the tool does not display an artificial estimate.
It is not intended to be a long-term capacity forecasting system. The metric is designed for immediate diagnosis: discovering that a runaway process could fill a filesystem within hours can be considerably more useful during an incident than simply knowing that the partition is 78% full.
No daemon, database, or backend
Diskwatch clearly defines what it does not try to be.
It is not a multi-server monitoring solution.
It is not a daemon.
It does not store metrics in a database.
It does not delete files.
It does not create backups.
And it is not a benchmarking tool.
Diskwatch observes the current state of the system and disappears when the user closes it.
That approach can be attractive on servers where installing a complete observability agent would be excessive, or where the administrator simply needs an immediate answer to a specific question.
It also reduces operational overhead: there is no persistent service to maintain, no backend to deploy, and no credentials needed to send data to an external platform.
The trade-off is obvious. When Diskwatch is not running, there is no historical data to inspect later.
If the problem happened overnight and stopped before anyone connected to the server, the tool cannot reconstruct it.
Installation through Homebrew, Cargo, Nix, or Arch
The project offers several installation methods:
brew install diskwatchRust users can install it with:
cargo install diskwatchPackages are also available for Nix and Arch Linux, along with prebuilt Linux and macOS binaries for x86_64 and ARM64.
Linux users can additionally download static musl builds designed to reduce dependencies on the target system.
Configuration is optional. Diskwatch runs without a configuration file, although users can generate one with:
diskwatch --write-configFrom there, settings such as the theme, default view, SMART interval, columns, and watched paths can be customized.
To restrict file monitoring to a particular location:
diskwatch --watch ~/srcOr to add another path while keeping the defaults:
diskwatch --watch-add /srv/dataOn Linux, every recursively monitored directory consumes an inotify watch. Pointing Diskwatch at a very large directory tree can therefore exhaust fs.inotify.max_user_watches. The program detects this condition and reports the affected path rather than simply returning the generic No space left on device error, which could easily send an administrator looking at df for a disk-space problem that does not exist.
Diskwatch is released under the MIT license, with its source code publicly available on GitHub.
Its value is not necessarily in replacing iostat, iotop, lsof, or smartctl individually. Those tools still provide much deeper information in their respective areas. Diskwatch instead tries to shorten the first few minutes of troubleshooting.
When a server suddenly starts hammering its storage, the first question rarely requires an entire observability platform.
It is usually much simpler: which file is being hit, and which process might have it open?
Diskwatch tries to answer that from a single terminal.