
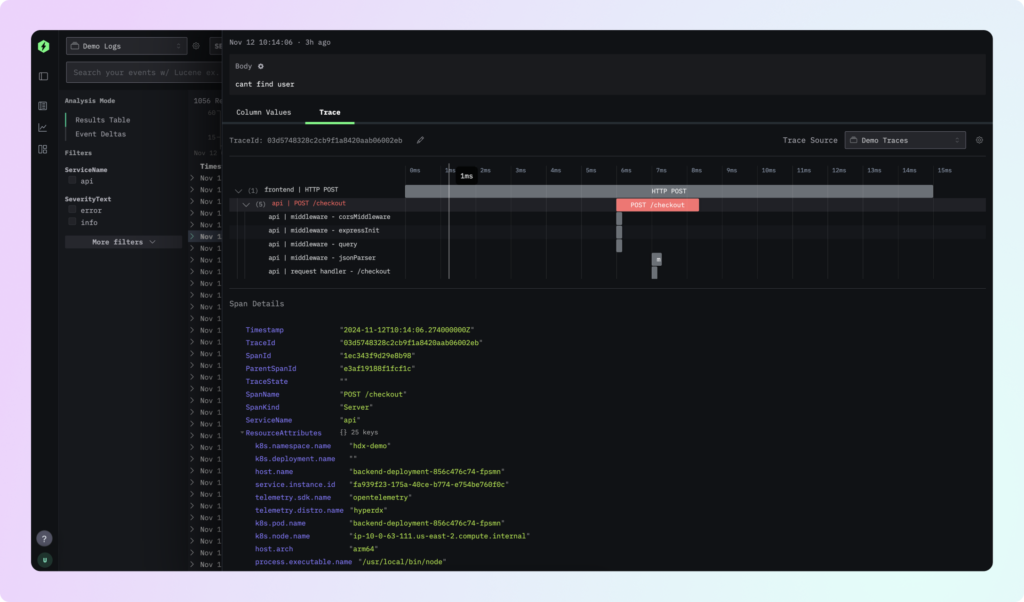
HyperDX, the open-source observability platform that unifies logs, metrics, traces, errors and session replays, now goes by ClickStack, ClickHouse’s observability offering. It keeps the MIT licence and the original GitHub repository, which is close to 10,000 stars, and it can be started as a single Docker container that bundles the database, the UI and an OpenTelemetry collector.
ClickStack, formerly HyperDX, key facts in 30 seconds
- HyperDX has been renamed ClickStack and is part of ClickHouse’s observability offering.
- It brings logs, metrics, traces, errors and session replay into one interface under the MIT licence.
- The all-in-one image ships ClickHouse, the UI, the OpenTelemetry collector and MongoDB.
- For testing, 4 GB of RAM and 2 cores are recommended.
- It collects anonymous usage data, which can be switched off with an environment variable.
The project started from a premise its documentation states plainly: observability tools tend to get expensive once telemetry reaches terabytes, need specialists to set up and force engineers to hop between apps to piece an incident together. Its answer is to build on ClickHouse, a columnar database that is very fast at aggregations, and put an interface on top that the docs compare to Kibana.
What it offers for debugging production
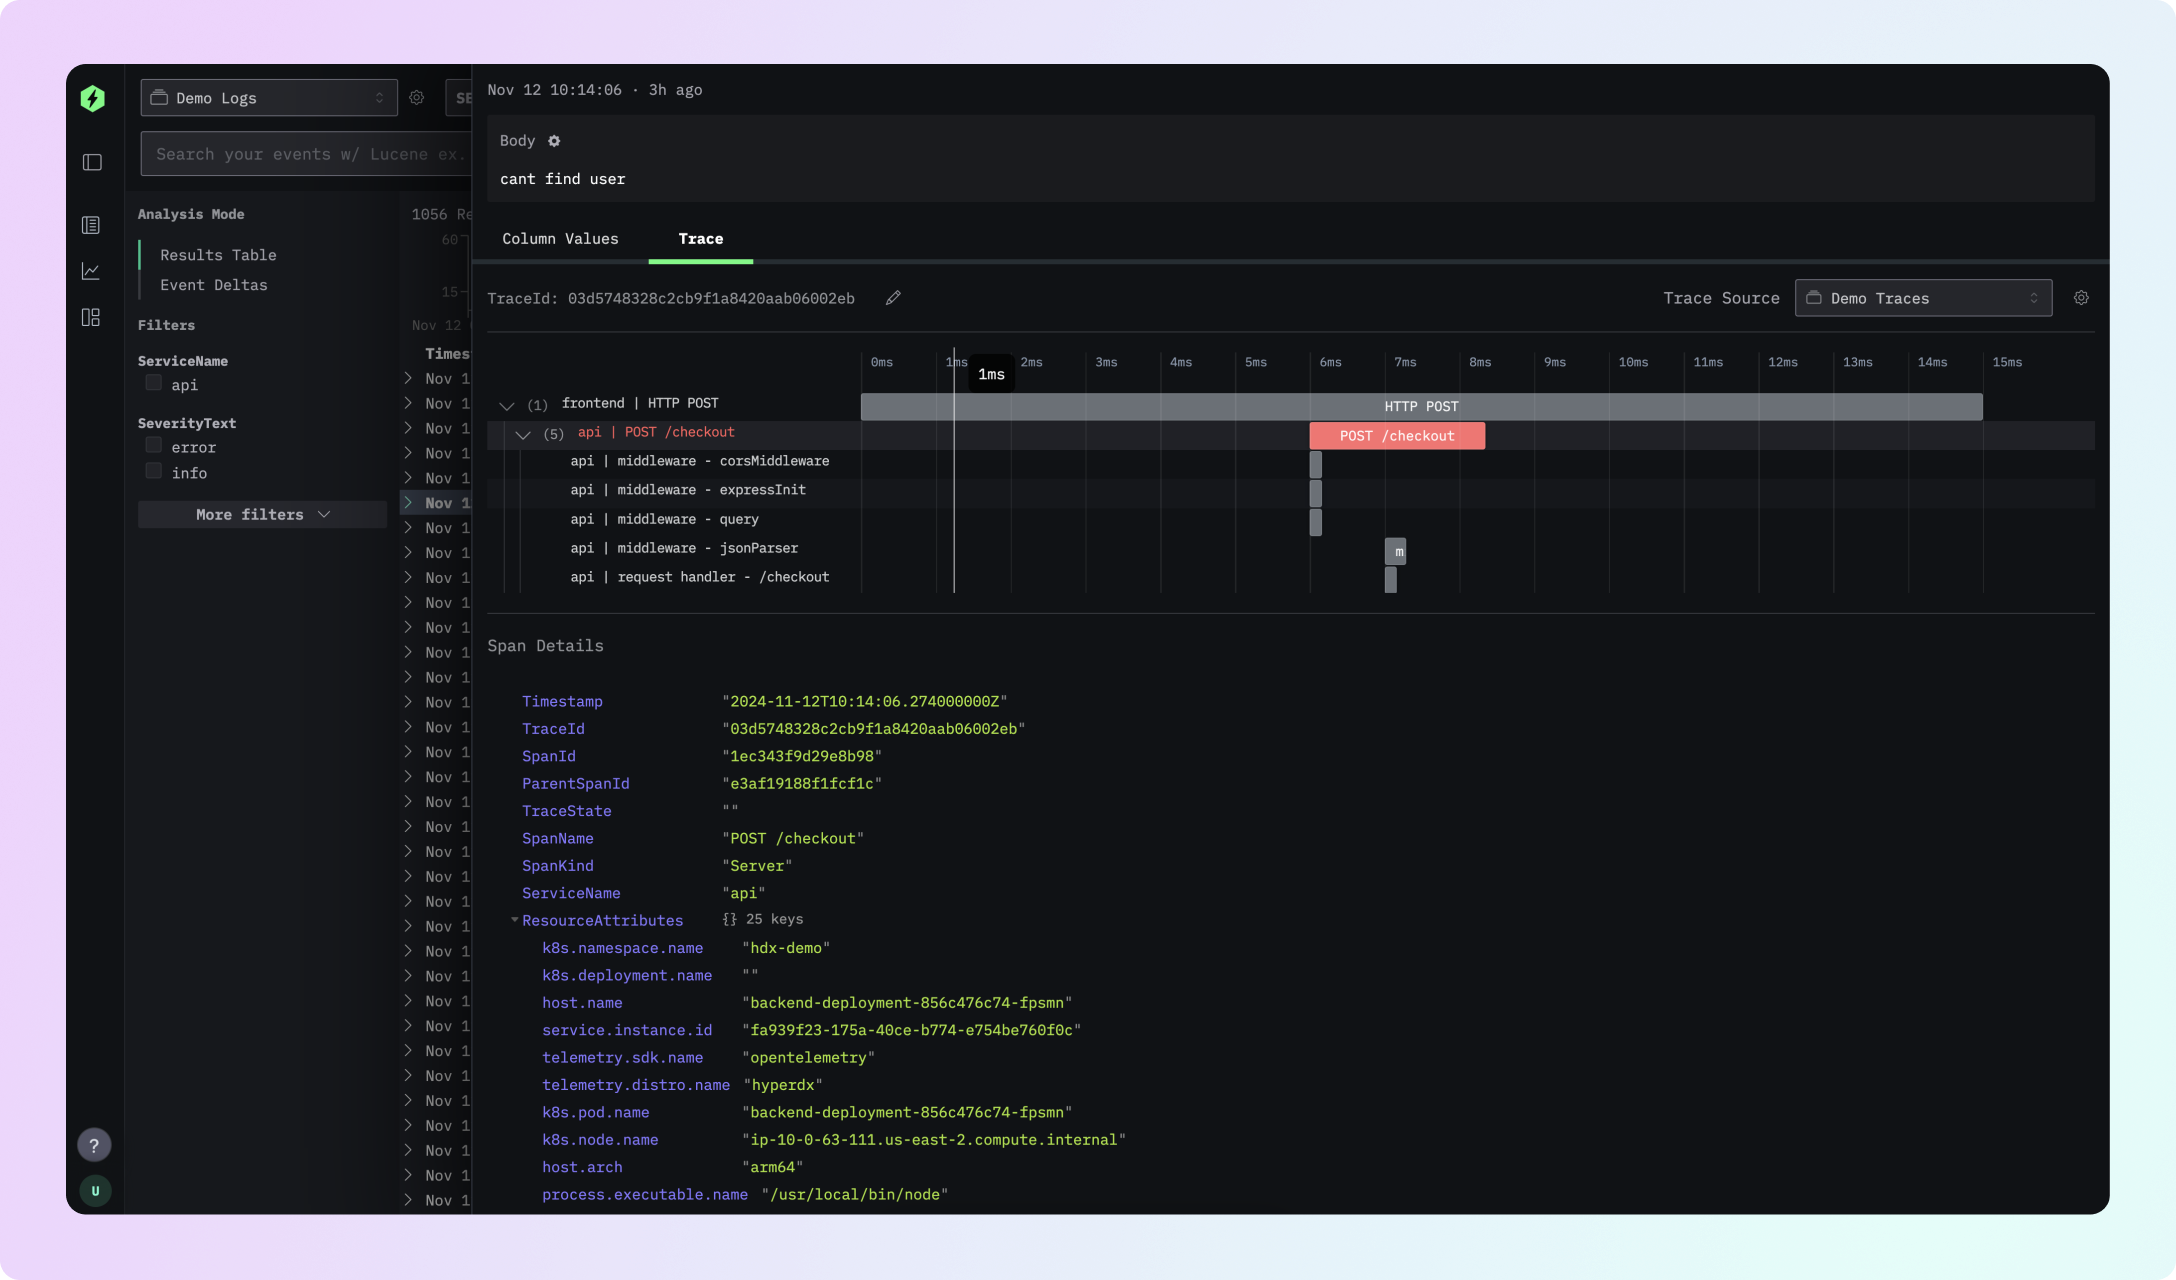
The core idea is correlation. From a slow trace you can jump to the logs for that request and to the session replay of the user who triggered it, without switching tools. Search accepts free text and a property syntax such as level:err, so SQL is optional, although it is there for those who prefer it.
According to the repository, ClickStack works on top of whatever ClickHouse schema you already have, can live-tail logs and traces, sets up alerts in a few clicks, builds dashboards on high-cardinality events without a complex query language and queries JSON natively. It also covers application performance monitoring (APM), from HTTP requests down to database queries, plus event deltas to analyse anomalies.
Running it with Docker and the ports you need
The fastest way to try it is the all-in-one image, which bundles ClickHouse, the ClickStack UI, the OpenTelemetry collector and MongoDB:
docker run -p 8080:8080 -p 4317:4317 -p 4318:4318
  docker.clickhouse.com/clickhouse/clickstack-all-in-one
The UI is then available at http://localhost:8080. Ports 4317 and 4318 are the standard OpenTelemetry ports for gRPC and HTTP. If the server sits behind a firewall, the documentation asks you to open 8080 for the UI, 8000 for the API and 4318 for the collector. For testing it recommends at least 4 GB of RAM and 2 cores. Anyone with an existing ClickHouse cluster, or planning a production deployment, will find other options in ClickHouse’s deployment docs, and there is also a managed version on ClickHouse Cloud.
To send data there are dedicated SDKs for the browser, Node.js and Python, and support for any OpenTelemetry SDK: Kubernetes, JavaScript, Python, Java, Go, Ruby, PHP, .NET, Elixir and Rust, among others. You just point the exporter at the collector, http://localhost:4318 on a local install.
A CLI for the terminal, and usage data
For those who would rather stay in the shell, the @hyperdx/cli package installs the hdx command, with a text interface for searching, live-tailing logs and viewing trace waterfalls with vim-style keys. It can also render dashboard tiles as ANSI output and offers raw SQL and NDJSON output aimed at scripts and AI agents:
npm install -g @hyperdx/cli
hdx auth login
hdx tuiCode language: CSS (css)
One detail worth knowing before deploying: open-source installations send anonymous usage data. It is switched off with the USAGE_STATS_ENABLED=false environment variable, which makes sense in environments with strict privacy requirements or no outbound internet access. The project has also tightened its contribution policy: a maintainer must vouch for each new contributor before their first pull request is reviewed, to filter out AI-generated submissions with no understanding behind them, as the repository itself explains.
Frequently asked questions
Are HyperDX and ClickStack the same thing?
Yes. The HyperDX repository now presents the product as ClickStack, ClickHouse’s observability solution, and keeps the MIT licence.
What are the minimum requirements?
For testing, the documentation recommends at least 4 GB of RAM and 2 cores. In production it depends on telemetry volume and how ClickHouse is sized.
Does it work with OpenTelemetry?
Yes. It includes an OpenTelemetry collector and accepts data from any compatible SDK on ports 4317 and 4318.
Does it send data to third parties?
Open-source installations send anonymous usage data by default. It can be turned off with USAGE_STATS_ENABLED=false.
Sources: