
Participation inequality in digital environments is neither a recent nor accidental phenomenon. From the earliest bulletin boards to today’s sophisticated platforms, one constant remains immutable: an active minority generates most of the content consumed by a silent majority. This pattern, formalized by Jakob Nielsen in 2006 as the “90-9-1 rule,” continues to be one of the most fundamental—and often underestimated—dynamics of digital behavior.
Theoretical Foundations and Empirical Evidence
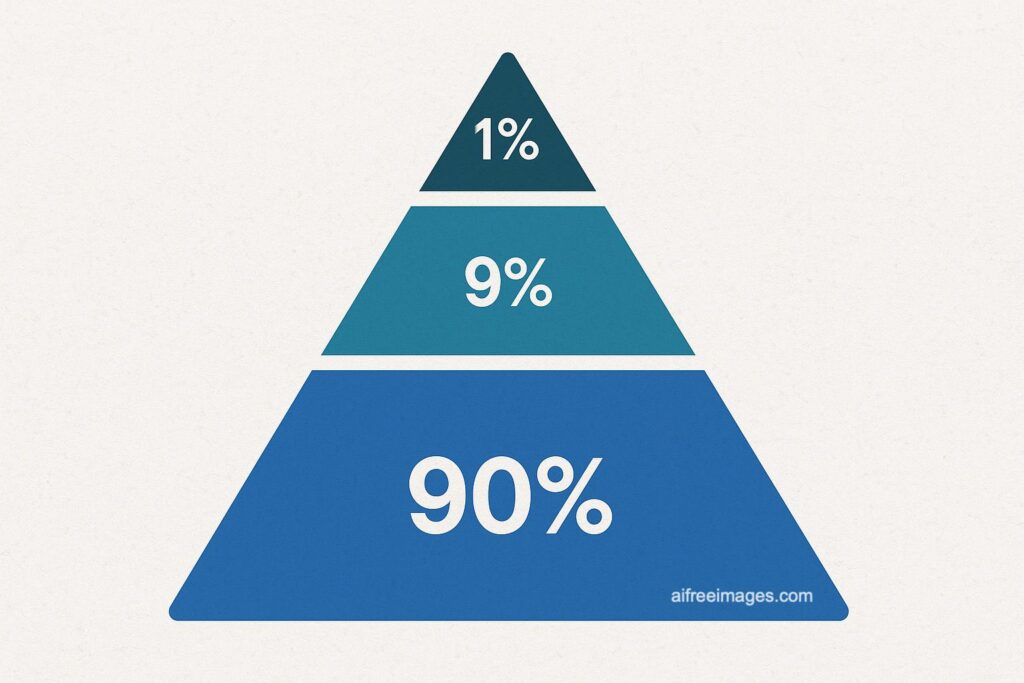
The 90-9-1 rule establishes that in any online community, approximately 90% of users are lurkers (passive observers), 9% contribute occasionally, and only 1% generate the majority of content. This distribution is not arbitrary: it reflects a digital manifestation of Zipf’s law, where the frequency of any event is inversely proportional to its rank in the frequency table.
Will Hill, researcher at AT&T Bell Laboratories, pioneered documenting this phenomenon in the 90s, long before social networks existed. His studies on Usenet newsgroups revealed that when user activity is graphed on a log-log diagram, the result is a straight line characteristic of power law distributions¹.
A fundamental study by Whittaker et al. analyzed over 2 million messages on Usenet and found that 27% of posts came from people who had posted only once, while the most active 3% contributed 25% of all messages². The statistical implication is striking: a randomly selected post was equally likely to come from one of the 580,000 low-frequency contributors as from one of the 19,000 highly active contributors.
Quantitative Analysis on Contemporary Platforms
Social Media Giants
The most recent data reveals that the rule persists, though with significant variations depending on the platform and type of community.
TikTok presents a particularly interesting case. With 1.58 billion monthly active users³, the platform maintains the highest engagement rate in the social ecosystem (2.5% per follower), but this doesn’t fundamentally alter the content creation distribution. US users consume 4.8 billion daily minutes of content, while effective video creation remains concentrated in a minimal fraction of the user base⁴.
Instagram, with 2 billion MAU, exhibits even more pronounced metrics toward passivity. Its average engagement rate of 0.50% per follower represents a 28% drop from the previous year⁵, suggesting that platform growth is further diluting active participation. Particularly revealing is that 61% of users report using Instagram to discover products⁶, but conversion to related content creation remains minimal.
YouTube exemplifies the rule in its most extreme form. Despite its 2.5 billion monthly users, the platform effectively functions as a unidirectional broadcast medium for most of its audience. US users collectively dedicate over 2.2 billion weekly hours to consuming short-form video⁷, but content creation remains in the hands of a creator elite.
Specialized and Technical Platforms
Stack Overflow represents one of the most documented cases of extreme participation inequality. With over 50 million unique monthly visitors, the platform effectively operates with fewer than 5,000 users with more than 10,000 reputation points maintaining content quality for the entire community⁸.
A longitudinal analysis of Stack Overflow participation revealed a concerning trend: while new user participation shows moderate increase, experienced users (with more than 500 reputation points) maintain stable or decreasing activity levels⁹. This polarization suggests the platform faces challenges in retaining experienced contributors, a pattern that could indicate content saturation or community fatigue.
Discord, with 200 million monthly active users distributed across 21 million servers¹⁰, presents unique dynamics due to its decentralized architecture. However, informal analyses suggest that most users participate in consumption mode (reading messages, listening to voice conversations), while active moderation, event organization, and structured content creation remain in the hands of a minority.
Enterprise Environments: Case Studies
Enterprise Social Network (ESN) implementation provides particularly valuable data due to its controlled nature and availability of detailed metrics.
A comprehensive analysis of an ESN with over 130,000 employees revealed patterns that go beyond the traditional 90-9-1 rule¹¹. During a two-month period:
- Only 3.26% of users posted more than 2 messages
- 1.47% made between 1-2 posts
- 95.27% remained as pure lurkers
This data suggests a distribution closer to 95-4-1, indicating that professional environments may exhibit even greater passivity than public social networks.
A longitudinal study of enterprise crowdsourcing demonstrated, however, that it’s possible to significantly alter these proportions¹². Through structured incentives and gamification, some organizations have achieved 33-66-1 distributions, where 33% become “super contributors,” 66% occasional contributors, and only 1% remain completely inactive.
Evolution and Challenges to the Traditional Rule
Evidence of Change in Modern Communities
Research by Higher Logic (2024) based on analysis of multiple online communities suggests that the 90-9-1 rule is experiencing significant evolution¹³. Their findings indicate:
- Small communities (< 1,000 members): up to 76% active participation
- Medium communities (10,000-50,000 members): 20% participation, with balanced distribution between creation (10%) and reaction (10%)
- Large communities (50,000+ members): more than 5% in active content creation
This data contrasts markedly with traditional rule predictions and suggests that factors like community size, thematic specialization, and engagement tools have measurable impacts on participation.
Technological Factors Influencing Participation
Reduced friction in creation. Platforms like TikTok have democratized video production through integrated editing tools, extensive sound libraries, and recommendation algorithms that can viralize content from novice creators. This reduction in technical barriers correlates with increased creative participation, although aggregate data still reflects fundamental inequality.
Micro-interactions as gateway. The introduction of reactions (beyond simple likes), ephemeral stories, and other forms of low-commitment participation have created an intermediate category between pure lurking and active creation. These micro-contributions may be altering the traditional distribution by creating more gradations in the participation spectrum.
Personalization algorithms. Algorithmic feeds have fundamentally transformed the relationship between creators and audiences. While traditional chronological platforms correlated visibility directly with following, modern algorithms can amplify emerging voices, potentially incentivizing greater creative participation.
Technical and Design Implications
Information Architecture and UX
Interface design has a direct measurable impact on participation rates. Usability research has identified several critical factors:
Progressive onboarding. Platforms that implement gradual onboarding systems, where users are progressively introduced to creation functionalities, show better lurker-to-contributor conversion rates¹⁴.
Immediate feedback loops. Implementation of immediate response systems (push notifications, real-time metrics, etc.) correlates positively with new contributor retention.
Content scaffolding tools. Systems that provide templates, content suggestions, or auto-completion tools significantly reduce the “blank page anxiety” that inhibits potential contributors.
Algorithmic Considerations
Content discovery vs. content creation. Recommendation algorithms optimized exclusively for engagement can inadvertently disincentivize content creation by creating a vicious cycle where only already popular content receives visibility.
Algorithmic diversity. Conscious diversity implementations in ranking algorithms can create opportunities for new contributors, though this must be carefully balanced against short-term engagement metrics.
Consequences for Data-Driven Decision Making
Biases in Analytics and Business Insights
The 90-9-1 rule has profound implications for interpreting community metrics. Companies making strategic decisions based on online feedback are effectively optimizing for the preferences of a very specific and potentially unrepresentative subset of their user base.
Biased sentiment analysis. Sentiment analysis algorithms applied to social media disproportionately capture opinions of hyperactive users, who may exhibit behavioral patterns, demographics, or motivations fundamentally different from the silent majority.
Product feedback loops. Product decisions based on online community feedback can lead to optimizations that benefit power users while alienating the silent majority, creating a suboptimal optimization cycle.
Adaptive Research Methodologies
Stratified sampling. Effective research in online communities requires methodologies that account for unequal participation distribution. Sampling techniques that overrepresent lurkers can provide more representative insights about actual user experience.
Passive research methods. Behavioral analytics (clickstream, time on page, navigation patterns) provide insights about the silent majority that aren’t reflected in traditional engagement metrics.
Future Perspectives: Web3 and Emerging Technologies
Tokens and Economic Incentives
Web3 architectures are experimenting with economic models that could fundamentally alter 90-9-1 dynamics. Token-gated communities and crypto reward systems create direct economic incentives for participation that didn’t exist in traditional Web2 platforms¹⁵.
Early data from platforms like Mirror, Lens Protocol, and other decentralized applications suggests that economic incentives can increase participation, though it’s premature to determine whether this alters fundamental distribution or simply changes existing participants’ motivations.
AI-Augmented Creation
AI-assisted content generation tools (GPT-based writing assistants, AI image generation, etc.) are dramatically reducing technical barriers for content creation. However, preliminary research suggests these tools may be primarily adopted by already active users, potentially amplifying rather than reducing participation inequality.
Strategic Conclusions and Recommendations
The 90-9-1 rule remains a fundamental characteristic of digital communities, though its specific manifestation is evolving in response to technological and design changes. For organizations dependent on online communities, the implications are multiple:
For community managers: Recognize that optimizing for lurkers may be more valuable than attempting to convert them into active contributors. The silent majority provides value through network effects, behavioral data, and eventual conversion to paying users.
For product designers: Implement multiple participation levels that allow gradual contributions rather than requiring total commitment to content creation.
For data scientists: Develop metrics and KPIs that account for passive user value rather than optimizing exclusively for active engagement.
The 90-9-1 rule is not a problem to solve, but a characteristic to understand and optimize. The most successful platforms of the future will be those that consciously design for the entire participation distribution, not just the hyperactive minority.
References
- Nielsen, J. (2006). Participation Inequality: The 90-9-1 Rule for Social Features. Nielsen Norman Group.
- Whittaker, S., Terveen, L., Hill, W., & Cherny, L. (1998). The dynamics of mass interaction. Proceedings of the SIGCHI conference on Human factors in computing systems.
- Sprout Social. (2025). 28 TikTok statistics marketers need to know in 2025.
- Wallaroo Media. (2024). TikTok Statistics – Everything You Need to Know.
- Social Insider. (2024). TikTok vs. Reels vs. Shorts: A Study by Socialinsider.
- Sprout Social. (2025). Social Media Demographics to Inform Your 2025 Strategy.
- Search Engine Journal. (2024). Social Media In 2024: YouTube & Facebook On Top, TikTok Growing.
- Meta Stack Overflow. (2020). What are the number of active participants joining Stack Overflow every day?
- Stack Overflow Blog. (2019). What a very bad day at work taught me about building Stack Overflow’s community.
- Business of Apps. (2025). Discord Revenue and Usage Statistics.
- Garfield, S. (2025). 90–9–1 Rule of Thumb: Fact or Fiction? Medium/LinkedIn.
- ACM Digital Library. (2010). Crowdsourcing participation inequality. Proceedings of the ACM SIGKDD Workshop on Human Computation.
- Higher Logic. (2024). How We Know the 90-9-1 Rule for Online Community Engagement is Officially Outdated.
- Bettermode. (2025). 1% Rule in Online Communities: Maximizing Engagement.
- Medium/@cotoapp. (2022). Tackling The 90:9:1 Rule With Web3 Communities.
Source: 90-9-1 in Messenger.es