
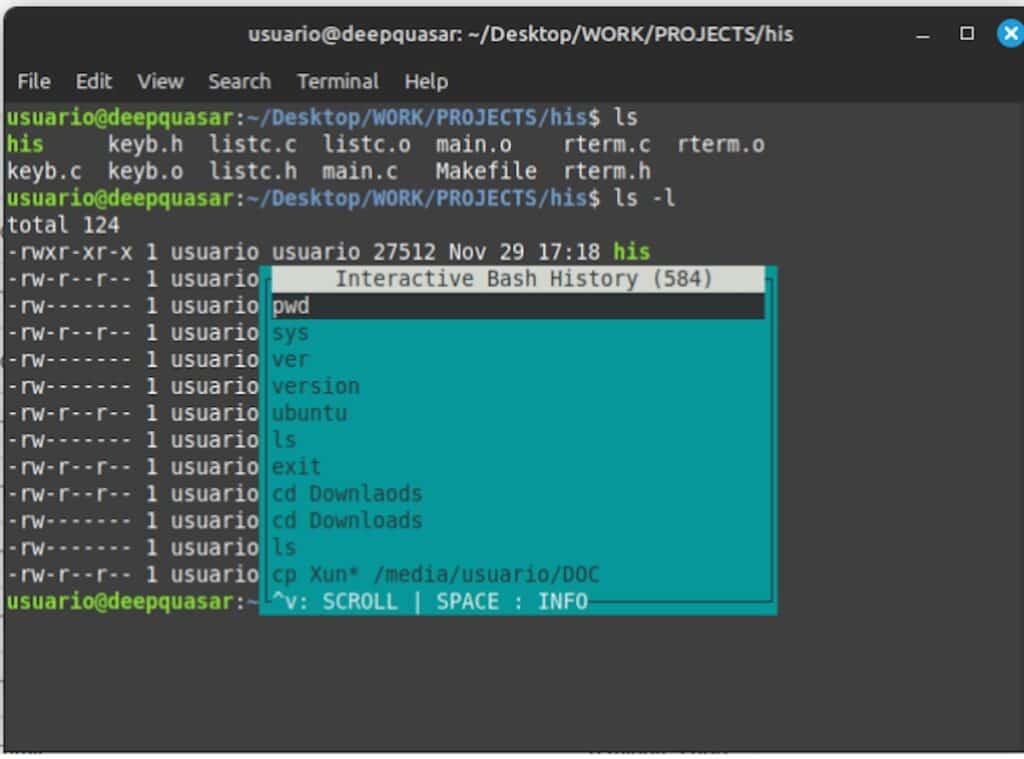
Text-based interfaces are becoming increasingly useful on Linux, and nostalgia has very little to do with it. Modern TUIs (Text User Interfaces) can monitor servers, investigate performance problems, manage containers, operate Kubernetes clusters, inspect networks, work with Git, query databases, browse logs and navigate millions of files without leaving the terminal. For a system administrator working over SSH, that combination of speed, low overhead and remote accessibility can be more practical than many graphical applications.
The key Linux TUI trends in 30 seconds
- A TUI provides a persistent interactive interface inside the terminal rather than executing one command and exiting.
- btop, below, ncdu, bandwhich and bottom are particularly useful for Linux troubleshooting.
- k9s, lazydocker and dive provide terminal interfaces for Kubernetes and container workflows.
- lazygit, Yazi, fzf, Broot, Posting, Neovim and Helix cover development and everyday administration.
- Tools such as lazysql and Dolphie extend the TUI approach to databases.
- Their biggest sysadmin advantage remains simple: most work locally and remotely over SSH.
The distinction from a traditional command-line interface (CLI) is worth making. Commands such as ps, du, git log or docker ps perform an operation, print information and return control to the shell. A TUI stays open, continuously updates information and lets the user navigate panels, select processes, inspect resources or execute actions.
That does not make TUIs a replacement for the CLI. Commands remain better suited to scripting, automation and reproducible operations. TUIs excel when administrators need to observe, search, compare and react.
Modern terminal emulators have also helped. Unicode, 24-bit color and better rendering make it possible to build interfaces that bear little resemblance to the monochrome terminal applications of previous decades.
Troubleshooting Linux servers without leaving SSH
For system administration, the most useful place to start is with tools that help answer a familiar question: what is happening to this machine?
1. btop: CPU, memory, disks, network and processes
btop is probably one of the easiest introductions to modern TUIs. It presents CPU utilization, memory, storage, network activity and processes in a single interactive interface.
Administrators can filter processes, inspect details and send signals without repeatedly combining ps, top, free, iostat and other commands.
It does not replace Prometheus, Grafana, sar or historical observability. Its strength is immediate investigation: SSH into a server, launch btop and obtain a readable overview within seconds.
2. below: go back in time to investigate an incident
below, originally developed by Meta’s infrastructure team, addresses one of the biggest limitations of traditional process monitors.
top, htop and btop are excellent at showing what is happening now. But what if the incident happened at 03:20 and the administrator connects at 07:00?
below can record system information and later replay it through an interactive interface.
That makes it particularly interesting for Linux operations. Instead of discovering that CPU usage was high four hours ago, an administrator can investigate what the machine looked like around the time of the event.
It is not a complete observability platform, but it bridges an important gap between real-time process monitors and full monitoring stacks.
3. ncdu: when the filesystem is suddenly full
Some Linux emergencies never change:
No space left on devicencdu remains one of the fastest ways to investigate disk usage from a terminal. It scans a directory tree, displays its contents by size and lets the administrator navigate down until the space-consuming directories or files are found.
It is considerably more convenient for exploratory troubleshooting than repeatedly running variations of du, sort and cd.
The ability to delete files from the interface should obviously be treated carefully on production systems.
4. bandwhich: which process is consuming the network?
bandwhich answers another common incident-response question: what is using the bandwidth?
It can display network utilization by process, connection and remote address. On Linux it observes an interface and correlates network traffic with process information.
It is useful when unexplained traffic appears on a machine and an administrator wants something more interactive than manually combining socket, process and packet-analysis commands.
The project has indicated that development is currently focused mainly on maintenance rather than new features, which is worth considering before making it a critical part of an operational workflow.
5. bottom: another modern alternative to top
bottom, launched with the btm command, provides another modern interpretation of system monitoring.
Written in Rust, it can display CPU, memory, network, disks, temperatures and processes in a configurable terminal interface.
There is little reason to install every process monitor available. The interesting point is that top and htop are no longer the only serious choices for interactive Linux monitoring.
Kubernetes and container operations
TUIs become even more interesting when they move beyond monitoring a single Linux host.
6. k9s: Kubernetes from the terminal
kubectl is extremely powerful, but repeatedly typing long commands with resource names, namespaces and output options can become cumbersome during troubleshooting.
k9s provides a continuously updated interface for navigating Kubernetes resources.
Administrators can inspect pods, deployments and services, follow logs, access containers and perform common operational actions without rebuilding commands each time.
It is particularly useful over SSH because it provides much of the convenience associated with graphical Kubernetes dashboards without requiring a browser-based management interface.
It should complement rather than replace kubectl. The CLI remains ideal for exact, documented and automated operations; k9s is often faster when exploring a live cluster.
7. lazydocker: Docker without juggling five commands
Docker troubleshooting frequently means switching between:
docker ps
docker logs
docker stats
docker inspect
docker exec
lazydocker puts containers, images, volumes and related information into a navigable interface.
Logs, statistics and common container operations are available without constantly copying container names or IDs between commands.
As with k9s, convenience should not replace understanding. Production administrators should still know which Docker operations are being performed underneath the interface.
8. dive: understand what is inside a container image
dive is a useful addition to the original list because it addresses a different container problem.
Instead of managing running containers, it helps administrators and developers inspect Docker and OCI image layers.
The interface shows how an image changes layer by layer, which files were introduced and where space may be wasted.
That makes it useful when a supposedly simple application image unexpectedly grows to several gigabytes.
For platform teams trying to reduce image sizes or understand unfamiliar container builds, dive can reveal information that is cumbersome to reconstruct manually from a Dockerfile and image history.
Git, files and search
A large amount of daily administration consists of navigating repositories and filesystems rather than responding to incidents.
9. lazygit: an interactive interface for Git
lazygit turns Git into a panel-based terminal application covering files, branches, commits and stashes.
Its value becomes more apparent for operations such as partial staging, interactive rebasing, conflict resolution and cherry-picking.
It should not become an excuse for avoiding Git fundamentals. In fact, lazygit becomes much more useful when the administrator understands the underlying operations and uses the interface to execute them faster.
10. Yazi: a modern file manager written in Rust
Yazi provides multi-column filesystem navigation, previews, searching and file operations inside the terminal.
It is particularly convenient when exploring rather than navigating to a directory whose exact location is already known.
Modern terminal capabilities can also provide richer previews than traditional terminal file managers could offer.
For administrators who regularly inspect large application trees, backups, repositories or deployment directories, this can be faster than repeatedly alternating between cd, ls, find and less.
11. Broot: navigating very large directory trees
Broot approaches filesystem navigation differently.
It is designed to make large directory structures easier to search and understand without dumping thousands of entries onto the screen.
Administrators can progressively search trees, inspect files and locate unusually large directories.
That makes it particularly interesting on development machines, source trees and servers containing deeply nested application structures.
12. fzf: a small tool that changes how the shell works
fzf deserves a category of its own.
It is a general-purpose fuzzy finder that can turn almost any list into an interactive selection.
Files, shell history, Git branches, processes, SSH hosts and command output can all be fed into it.
Its integration with shell history is particularly useful. Instead of repeatedly pressing Ctrl+R and cycling through previous commands, administrators can search interactively for fragments of commands they remember.
The real strength of fzf is composition. It behaves more like a terminal building block than a standalone application.
Databases and APIs also move into the terminal
This is another area where the TUI ecosystem has become considerably more interesting.
13. lazydocker’s philosophy reaches SQL with lazysql
lazysql applies the familiar terminal-panel approach to databases.
It provides an interactive environment for navigating database objects and working with SQL without requiring a large graphical database client.
Its appeal is particularly clear when working through SSH, inside development environments or on machines where installing a complete desktop SQL application makes little sense.
A database TUI should still be treated with the same caution as any administrative client. Credentials, network access and production write permissions matter considerably more than the interface used to execute a query.
14. Dolphie: MySQL and MariaDB monitoring from the terminal
For administrators responsible for MySQL or MariaDB, Dolphie is another project worth knowing.
Its focus is not primarily SQL editing but real-time database monitoring.
It can provide visibility into queries, sessions, replication and server activity from a terminal interface, making it interesting when diagnosing database performance remotely.
This is exactly the type of workload where a TUI makes sense: the administrator wants continuously changing operational information rather than the static result of a single command.
15. Posting: API testing without a heavyweight desktop client
Posting brings HTTP API testing to the terminal.
Requests can be created and sent interactively, while responses are displayed with syntax highlighting. Collections and environments can be stored in files rather than being tied exclusively to a cloud account.
For development and operations teams, that has an additional benefit: API definitions and requests can live alongside other project files and be versioned with Git.
Editing, logs and remote sessions
A Linux administrator eventually has to edit something. Increasingly, the terminal can provide much more than basic Vim.
16. Neovim or Helix: development directly inside the terminal
Neovim can provide language servers, autocompletion, diagnostics, Git integration, fuzzy searching and extensive plugins.
Properly configured, it can behave like a complete development environment while remaining entirely inside the terminal.
Its downside is equally well known: configuration can become a project in itself.
Helix is worth considering for administrators and developers who want a modern terminal editor with more functionality available out of the box and less configuration.
For a two-line configuration change, Vim or even Nano may remain sufficient. For substantial remote development, Neovim and Helix become much more interesting.
17. lnav: logs deserve a better interface too
lnav, the Logfile Navigator, is one of the most useful additions for a sysadmin-focused list.
Linux troubleshooting frequently involves commands such as:
tail -f application.log
grep ERROR application.log
less application.log
journalctlCode language: CSS (css)
lnav provides an interactive environment for navigating and analyzing logs.
It can recognize different log formats, merge information chronologically and provide filtering and querying capabilities.
That makes it particularly useful when several logs need to be correlated during an incident.
It does not replace centralized logging systems such as Loki, Elasticsearch-based stacks or commercial observability platforms. But on an individual machine, especially during SSH troubleshooting, it can make log investigation considerably faster.
18. tmux: the tool that completes remote administration
tmux is not exactly a monitoring TUI, but it belongs on almost every serious sysadmin list.
It allows multiple terminal sessions and panes to run inside a single terminal and, more importantly, lets users detach from a session without terminating the processes inside it.
That changes remote administration completely.
A long upgrade, compilation or troubleshooting session can continue running if the administrator’s laptop loses connectivity. After reconnecting through SSH, the existing tmux session can simply be reattached.
For unreliable connections or long-running maintenance, that feature alone makes tmux invaluable.
Networking gets better terminal interfaces too
Network troubleshooting remains heavily CLI-oriented, but several tools add useful interactive visualization.
19. gping: ping with a graph
gping takes the familiar concept of ping and represents latency graphically inside the terminal.
This can make jitter, temporary latency increases and connectivity changes easier to recognize visually.
It does not replace mtr, traceroute, packet captures or monitoring systems. It simply provides a better interactive view for a specific diagnostic task.
20. termshark: Wireshark-style packet analysis in a terminal
For network administrators, termshark is one of the most interesting TUI additions.
It provides a terminal interface for packet captures and uses tshark underneath.
The concept is particularly useful on remote Linux systems where opening Wireshark locally is inconvenient or where packet analysis is being performed directly on a server reached through SSH.
Packets can be navigated and inspected interactively without requiring a graphical desktop.
It does not remove the need to understand capture filters, display filters, protocols or tcpdump. Instead, it provides another way to examine the resulting traffic.
As with any packet-capture utility, permissions need careful consideration. Giving an application access to raw network traffic is a security decision, not merely an installation choice.
Why TUIs make so much sense for sysadmins
The strongest argument for this category is simple: the machine containing the problem often has no desktop.
It might be a virtual machine, a physical server in a data center, a cloud instance, a Kubernetes node or a system reachable only through VPN and SSH.
Deploying a graphical administration interface may require additional services, ports, authentication and software.
A TUI mostly needs a terminal.
Resource consumption also matters. When the reason for connecting to a machine is that it is running out of memory or CPU, introducing a heavy management layer to discover why is not particularly attractive.
Modern implementation languages have also changed perceptions of terminal software. Many current TUIs are relatively recent projects written in Rust, Go, C++ or Python, designed by developers who had graphical alternatives available.
They chose the terminal because it fits the job.
There is, however, a security consideration that should not be ignored.
Administrators should not install twenty third-party binaries on every production server simply because they are convenient.
Tools should be assessed according to where they come from, how actively they are maintained and what privileges they require. A network monitor may require packet-capture capabilities. A Kubernetes interface may have access to production clusters. A file manager may delete data. A database TUI may have credentials capable of modifying production tables.
A friendly interface does not reduce the privileges of the process behind it.
A sensible starting point could therefore be btop for immediate system visibility, ncdu for storage, tmux for persistent remote sessions, fzf for searching and lnav for logs.
Everything else can be introduced when there is a real operational requirement: k9s for Kubernetes, lazydocker and dive for containers, Dolphie for MySQL, termshark for packet analysis, below for historical host investigation or Yazi and Broot for filesystem navigation.
That also explains why TUIs are not replacing traditional Linux commands.
The two approaches solve different problems.
CLI tools remain excellent for automation, repeatability and composition. TUIs are excellent for exploration, investigation and continuous interaction.
A sysadmin can connect over SSH, query systemd with journalctl, filter data with grep and awk, open btop to inspect a CPU spike, use lnav to correlate logs, launch termshark to investigate suspicious traffic and then return immediately to the shell.
No browser needs to be opened.
No remote desktop needs to be configured.
And no web dashboard needs to be exposed simply to make an infrastructure component easier to inspect.
The terminal is not trying to become a desktop again. In 2026, it simply has a much better generation of applications for the work that Linux administrators were already doing there.
Frequently asked questions
What is the difference between a CLI and a TUI on Linux?
A CLI usually accepts a command, performs an operation and returns a result. A TUI remains active and provides an interactive interface with navigation, panels, live updates and keyboard-driven actions.
What are the best TUIs for Linux system administrators?
A strong sysadmin toolkit includes btop, below, ncdu, lnav, tmux and bandwhich. k9s is particularly useful for Kubernetes, while termshark helps with packet analysis and Dolphie targets MySQL and MariaDB monitoring.
Do TUIs work over SSH?
Yes. That is one of their main advantages. Most terminal applications work over SSH without a graphical desktop, although richer interfaces may require a modern terminal with Unicode and 24-bit color support.
Can TUIs replace monitoring and observability platforms?
Usually not. Tools such as btop, below, Dolphie and lnav are excellent for interactive investigation, while Prometheus, Grafana and centralized logging platforms are designed for long-term storage, alerting, correlation and infrastructure-wide observability.