
Diagnosing a network path is still more manual than it may seem. Traceroute helps show where packets travel, mtr adds continuous statistics, and ping remains the quick tool to check whether something responds. But when the problem lies in a poorly adjusted MTU, a route that changes intermittently, ECMP load balancing, NAT rewriting ports, or a router rate-limiting ICMP, traditional tools can fall short.
ttl was created precisely for that space between basic diagnostics and heavier network observability tools. The project presents itself as a fast, modern traceroute with a real-time TUI, per-hop statistics, ASN and geolocation lookup, ECMP detection, MPLS label parsing, and features designed to solve real connectivity problems. Its own repository defines it as a network diagnostic tool that goes beyond traceroute, with MTU discovery, NAT detection, route flap alerts and Internet Exchange identification.
What it adds compared with traceroute and mtr
The main difference is that ttl does not simply display a list of hops. Its goal is to monitor the path continuously, enrich each hop with useful information and detect patterns that are often hidden behind hard-to-reproduce incidents. In real environments, a one-off trace may not say much: the fault appears and disappears, the route changes depending on the flow, a firewall filters ICMP, or a VPN introduces an MTU issue that only appears with certain packet sizes.
ttl can run traces against several destinations at once, switch between them from the interface, export results in JSON, CSV or text, and replay saved sessions. It also supports ICMP, UDP and TCP probes with auto-detection, which is useful when a network filters a specific protocol or when testing behaviour towards common ports such as 443 or 80.
The tool is written in Rust and can be installed from crates.io with cargo install ttl, although it also offers options through Homebrew, packages for several distributions, pre-built binaries and source builds. On Linux, it can run without sudo if the CAP_NET_RAW capability is granted; on macOS, FreeBSD and NetBSD it requires administrator privileges because it uses raw sockets. Native Windows is not supported, although it can be used through WSL2.
For system administrators, network operators and SRE teams, the interesting part is not only that it has a nicer interface. The relevant point is that it combines several checks in a single tool that would normally require switching between utilities, scripts and external queries.
ECMP, NAT, MTU and changing routes
One of ttl’s most powerful features is ECMP detection, short for Equal-Cost Multi-Path. In many modern networks, two packets to the same destination do not necessarily follow exactly the same path. Routers may choose the route based on a flow hash, usually built from elements such as source IP, destination IP, ports and protocol. A traditional traceroute may show only part of that reality.
ttl can launch several flows with --flows to enumerate different paths and distinguish between per-flow and per-packet load balancing. According to its documentation, the tool varies source ports to trigger different route selections, shows the detected paths and marks ECMP in the interface when it observes multiple responders at a hop.
It also includes NAT detection. This may sound secondary, but it is not when working with carrier networks, CGNAT, enterprise firewalls or tunnels. ttl compares the source port sent with the one that appears back in ICMP error messages. If it detects a mismatch, it warns that a device is rewriting ports. That information helps explain why flow correlation fails or why a multi-flow trace produces strange results.
MTU detection is another especially useful function. Path MTU Discovery problems often generate confusing symptoms: connections that hang, VPN tunnels that work for small traffic but fail with larger packets, services that respond only partially, or transfers that degrade without an obvious explanation. ttl implements a binary search to find the maximum unfragmented size, using the DF bit and ICMP Fragmentation Needed or Packet Too Big responses.
In practice, a command such as ttl --pmtud 1.1.1.1 can save a lot of time when a bad MTU is suspected on a VPN, WAN link or network with additional encapsulation.
The tool also detects route flaps, meaning changes in the IP responding at a specific hop. The indicator appears when the main responder changes, but it is suppressed if the variation is explained by ECMP. This distinction matters because not every hop change means instability: sometimes it is expected load balancing. ttl tries to separate both situations to avoid false diagnoses.
A useful tool for real networks, not just labs
ttl also adds data enrichment: reverse DNS, ASN, geolocation and IX identification through PeeringDB. This makes it possible to see not only the IP address of a hop, but also which network it belongs to or whether traffic is crossing an exchange point. In provider, cloud, CDN or international connectivity environments, that information can help explain latency changes, unexpected routes or differences between destinations.
MPLS label detection also has value for teams working close to carrier networks. Many paths cross MPLS infrastructures that a basic traceroute does not always interpret well. ttl parses ICMP extensions to extract MPLS labels when available, adding visibility into tunnels and internal paths.
Not everything is universally perfect. Like any probe-based tool, ttl depends on how intermediate routers respond, ICMP filters, firewall policies and the configuration of each network. A hop showing apparent loss may simply be rate-limiting ICMP responses and not dropping real traffic. The tool tries to mark possible rate limiting, but technical judgement is still required. No trace replaces knowledge of the architecture, BGP routes, network telemetry or service metrics.
Even so, ttl fits well into the day-to-day work of people diagnosing connectivity incidents. It can be used to compare routes to several public DNS services, check whether a provider changes paths under load, analyse differences between IPv4 and IPv6, detect MTU problems in tunnels, study routes to CDNs or document an incident with a reproducible export.
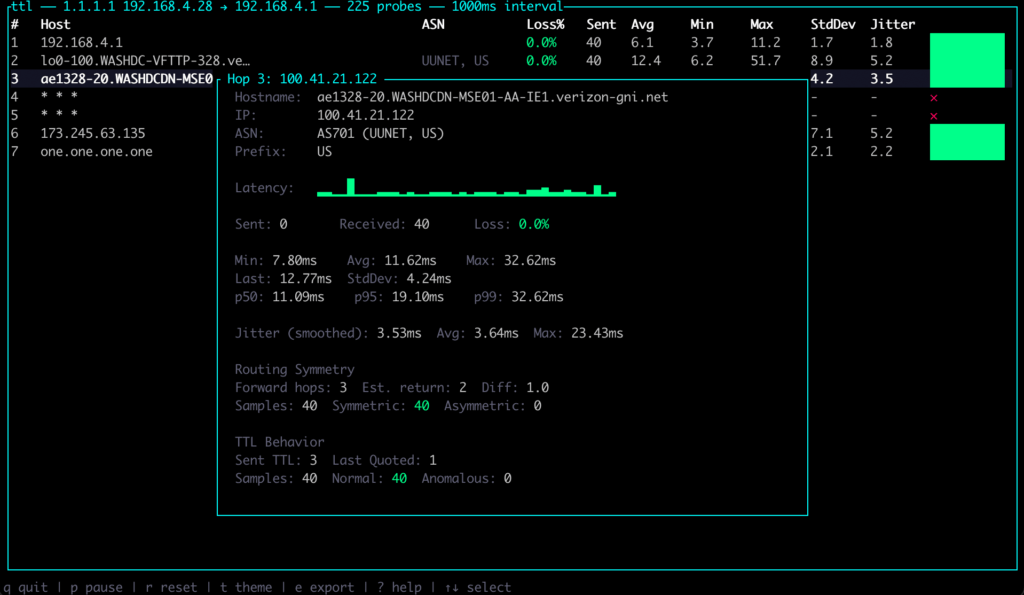
The repository also shows a clear focus on user experience. The TUI includes themes, sparklines, detailed per-hop views and session export. Keyboard shortcuts allow pausing, resetting statistics, changing theme, exporting, opening help or expanding a hop. These are not minor details: during an incident, visual clarity matters.
ttl is not trying to eliminate traceroute or mtr. They are familiar, lightweight tools and are enough for many quick diagnostics. But it does add a modern layer that better reflects what today’s networks look like: multipath, public clouds, tunnels, NAT, anycast, IXPs, MPLS and traffic filtered differently depending on protocol and port.
Perhaps the best definition is this: ttl is not just a nicer traceroute. It is a tool designed to make visible what normally requires several separate pieces of investigation. For system administrators, cloud operators, DevOps teams and connectivity managers, ttl may become one of those small utilities that end up living in the daily toolbox.
Frequently asked questions
What is ttl?
ttl is a network diagnostic tool that works as a modern traceroute, with a TUI interface, per-hop statistics, ECMP, NAT, MTU and route flap detection, MPLS parsing, ASN lookup, geolocation and IX identification.
How is it different from traceroute or mtr?
It adds advanced features that are normally not available in classic traceroute, such as multi-flow probing for ECMP, Path MTU Discovery, NAT detection, session export, MPLS analysis and route enrichment with ASN, GeoIP and PeeringDB.
Does it need special permissions?
Yes. On Linux, it can be used with the CAP_NET_RAW capability; on macOS, FreeBSD and NetBSD it usually requires sudo because it uses raw sockets.
What use cases is it best suited for?
It is especially useful for diagnosing MTU issues in VPNs, unstable routes, ECMP load balancing, CGNAT, differences between anycast destinations, ICMP filtering, multi-homed networks and routes crossing providers or exchange points.