
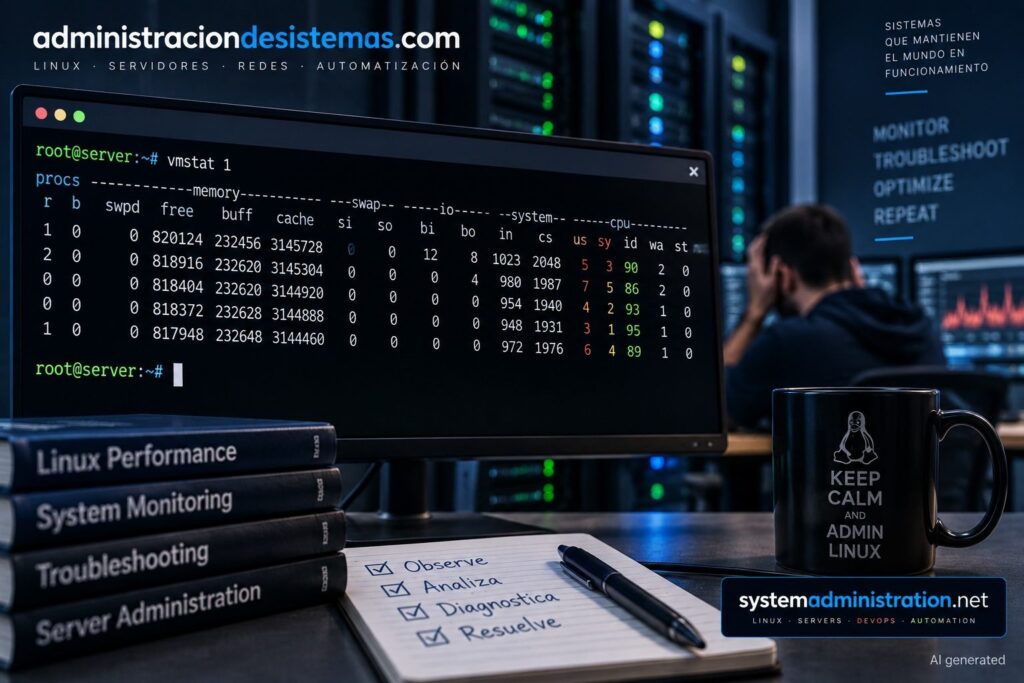
When a Linux server starts responding slowly, top and htop are usually the first commands administrators reach for. They are useful for finding processes consuming CPU or memory, but vmstat can answer a more important question first: which system resource is actually causing the slowdown. In a single line, it brings together run queues, blocked processes, memory, swap, I/O, interrupts, context switches, and CPU usage.
The key points about vmstat in 20 seconds
vmstatprovides a system-wide view of CPU, memory, swap, processes, and I/O.r,b,si,so,wa, andstcan quickly reveal several common bottlenecks.- For current troubleshooting, multiple samples are more useful than a single
vmstatrun. vmstat -y 1skips the initial report based partly on statistics accumulated since boot.- Once you identify the likely bottleneck, confirm it with tools such as
iostat,pidstat,free, orsar.
The advantage of vmstat is not that it replaces top. In fact, top also shows global CPU statistics, including I/O wait on standard procps-ng versions.
The difference is in how the information is presented.
vmstat lets you see at the same time whether tasks are queuing for CPU, whether processes are blocked, whether the kernel is actively swapping pages, how much block I/O is moving through the system, and where CPU time is going.
That makes it easier to decide which tool should come next, instead of immediately looking for a “bad” process before knowing whether a process is actually the problem.
How to read vmstat without getting lost in the columns
On Debian and Ubuntu, vmstat is usually provided by the procps package. On Red Hat-family distributions, it is part of procps-ng. On many systems, it is already installed.
The simplest command is:
vmstatFor troubleshooting a current slowdown, collecting several samples is more useful:
vmstat 1 10The first number is the interval in seconds. The second is the number of reports.
A typical output looks like this:
procs -----------memory---------- ---swap-- -----io---- -system-- -------cpu-------
 r  b   swpd   free   buff  cache   si   so    bi    bo   in   cs us sy id wa st
 2  0      0 2456784 128432 5234560  0    0     2     5  120  250  5  2 92  1  0
The procps-ng manual groups the columns into six sections:
| Section | Main columns | What it helps detect |
|---|---|---|
| Processes | r, b | CPU pressure and blocked tasks |
| Memory | swpd, free, buff, cache | RAM distribution |
| Swap | si, so | Active paging between RAM and swap |
| I/O | bi, bo | Block reads and writes |
| System | in, cs | Interrupts and context switches |
| CPU | us, sy, id, wa, st | Where CPU time is being spent |
There is one important detail about the first sample.
The vmstat documentation explains that the first report uses averages since the last reboot for statistics expressed as rates, while process and memory values are current. Later reports represent the interval you requested.
So it is not entirely accurate to say that every value on the first line is simply a “since boot average.”
If you want to skip that first report completely, use:
vmstat -y 1The -y or --no-first option suppresses it.
r: are processes waiting for CPU?
r is the number of runnable tasks, including those currently running and those waiting for CPU time.
r  b
8  0
A persistently high r value can indicate CPU pressure.
A common comparison is against the number of logical CPUs:
nprocIf the machine has four logical CPUs and r stays around 10, 15, or 20 while us or sy are high and id is close to zero, CPU saturation is a strong possibility.
It should not be treated as a rigid threshold.
A short spike above the number of CPUs is not automatically a problem. Persistence and the surrounding metrics matter more.
b: processes waiting on I/O
b counts processes blocked while waiting for I/O to complete.
A sustained high value deserves attention, especially if wa is also high.
For example:
r  b   ...  us sy id wa
1  12   ...   3  4 20 73
At that point, it makes sense to stop focusing on per-process CPU and investigate I/O instead.
A reasonable next step is:
iostat -xz 1vmstat tells you which direction to investigate. It does not tell you by itself which SSD, volume, network storage system, or process is causing the pressure.
Low free memory does not automatically mean low memory
The memory section often leads to bad diagnoses:
swpd   free   buff   cache
0      180000 95000  6200000
Linux deliberately uses available RAM as cache.
That means a small free value does not by itself prove memory pressure.
For a more intuitive view, use:
free -hand pay close attention to the available figure.
Inside vmstat, the columns that become especially useful when memory pressure is suspected are si and so.
si and so: when memory starts creating I/O
si shows memory being brought back from swap into RAM per second. so shows memory being moved from RAM into swap.
si   so
0    0
Having swap in use does not automatically mean the server is in trouble.
Linux may keep infrequently used pages in swap even when RAM is currently available.
The more useful warning sign is sustained activity in si, and especially so, while the system is performing poorly.
For example:
si    so
3500  5200
4200  6100
3900  5800
In that situation, some of the I/O you are seeing may be caused by memory pressure.
If you immediately blame storage, you may diagnose the wrong problem.
Check:
free -hand review the kernel logs for OOM activity:
journalctl -k | grep -i -E 'oom|out of memory|killed process'Code language: JavaScript (javascript)On systems where appropriate, dmesg can also be used, although access to the kernel buffer may be restricted for unprivileged users.
Five vmstat patterns that help identify the bottleneck
vmstat becomes much more useful when you read several columns together.
A single large number is usually only a clue. A repeated pattern is more meaningful.
1. High r, busy CPU, low wa
A pattern like this:
r  b   us  sy  id  wa
12 0   86   8   5   1
14 0   88   7   4   1
on a machine with only a few cores suggests a CPU-bound workload.
There are many runnable tasks, the CPU is barely idle, and I/O wait is low.
The next step may be:
toppidstat -u 1or a profiler such as perf if you need to identify exactly where CPU cycles are being spent.
2. High b and high wa
r  b   us sy id wa
1  14   3  5 18 74
Here, tasks are blocked and the CPU is recording a lot of I/O wait.
That is a good point to inspect disks and block devices:
iostat -xz 1But keep one caveat in mind: high wa does not prove that a physical disk is slow.
The cause could be network storage, cloud IOPS limits, synchronized workloads, filesystem behavior, or another I/O-related bottleneck.
vmstat shows the symptom. iostat and other tools help find the cause.
3. si and so stay active
If the system is continuously moving pages between RAM and swap while performance drops, memory becomes one of the first suspects.
Possible causes include an application using too much RAM, workload growth beyond the server’s capacity, or a specific memory configuration.
At this point, investigating memory and processes is more useful than tuning the SSD.
4. High st inside a virtual machine
The st column, or steal time, is especially useful on virtual machines.
It represents CPU time that the hypervisor used elsewhere while the VM was ready to run.
us sy id wa st
35 5  25 0  35
Persistently high st can indicate contention on the physical host.
The application inside the VM may not be able to solve that problem.
Depending on the environment, you may need to resize the VM, review host overcommit, migrate the instance, or investigate the cloud provider’s infrastructure.
5. An unusual number of context switches
cs shows context switches per second.
in      cs
3200    85000
A large number is not automatically bad.
Servers with many CPU cores, connections, and threads can perform tens of thousands of context switches without any issue.
What matters is an abnormal increase relative to that system’s normal behavior, especially if it coincides with worse performance and more kernel CPU time.
Then it can be useful to run:
pidstat -w 1to examine voluntary and involuntary context switches per process.
There is no universal cs number above which a server should be considered overloaded.
vmstat does not replace iostat, pidstat, or top
A good way to think about vmstat is as an initial triage tool.
When a performance alert appears, start with:
vmstat -y 1 10Then let the pattern determine what comes next:
| What vmstat shows | Possible next tool |
|---|---|
High r + busy CPU | top, pidstat -u, perf |
High b + high wa | iostat -xz, iotop |
Sustained si/so | free, ps, smem, kernel logs |
High st | Hypervisor or cloud-provider metrics |
Abnormal cs | pidstat -w, perf |
| Intermittent issue | sar, historical monitoring |
That workflow avoids one of the most common performance mistakes: confusing the symptom with the bottleneck.
A process can appear stalled in top without being the cause. A disk can show heavy activity because the system is running out of memory. A VM can look CPU-constrained when the real issue is outside the guest, at the hypervisor layer.
vmstat options worth remembering
You do not need to memorize dozens of flags for day-to-day troubleshooting.
A few are especially useful:
# One sample per second, skipping the initial cumulative report
vmstat -y 1Code language: PHP (php)
# Ten samples every two seconds
vmstat -y 2 10Code language: PHP (php)# Add timestamps
vmstat -t 1Code language: PHP (php)# Wider output
vmstat -w 1Code language: PHP (php)# Show active and inactive memory
vmstat -a 2 5Code language: PHP (php)# Cumulative system statistics
vmstat -sCode language: PHP (php)# Disk statistics
vmstat -dCode language: PHP (php)# Statistics for a specific partition
vmstat -p /dev/sda1Code language: PHP (php)# Display memory in MiB
vmstat -S M 1Code language: PHP (php)There is one detail worth correcting from many online cheat sheets: in currently documented procps-ng versions, -S accepts k, K, m, and M.
k and m use decimal multipliers, while K and M use 1,024 and 1,048,576 bytes respectively.
vmstat -S G is not listed as a supported unit in the current official documentation.
Also, -S does not change the units used by bi and bo, which procps-ng documents in KiB per second.
The important thing is not just running vmstat, but reading it correctly
vmstat has one major advantage that becomes obvious during real incidents: it forces you to look at the server as a whole system.
CPU, memory, and I/O do not operate independently.
Low RAM can cause swap activity. Swap can create heavy I/O. Heavy I/O can block processes. Blocked processes can make the application simply look “slow.” A VM can have enough RAM and storage and still perform badly because the hypervisor is not giving it the CPU time it expects.
Looking only at the process at the top of top can hide that chain.
That is why a sensible first move when a server suddenly slows down can be:
vmstat -y 1 10Not because vmstat can explain every incident on its own, but because within a few seconds it can tell you whether your next step should focus on CPU, memory, storage, processes, or virtualization.
After that come top, iostat, pidstat, sar, perf, iotop, or whichever specialized tool fits the evidence.
The order matters: first identify the type of bottleneck, then find out what is causing it.