
The release of Proxmox Virtual Environment (VE) 9.0 marks a qualitative leap in how system administrators can monitor and manage virtualized infrastructures. One of the most significant new features is the integration of Pressure Stall Information (PSI), an advanced Linux kernel metric that accurately measures how long processes spend waiting for critical resources such as CPU, memory, or I/O.
For administrators accustomed to tools like htop, iostat, or load average metrics, PSI integration in Proxmox provides much more granular—and most importantly, actionable—visibility.
What Is Pressure Stall Information (PSI)?
Pressure Stall Information is a subsystem introduced in the Linux kernel starting with version 4.20 (2018). Its purpose is to standardize how the kernel quantifies the time processes are stalled due to lack of immediate access to resources.
Put simply, when processes compete for CPU, memory, or disk access, some end up waiting. Until now, administrators only had indirect metrics: system load, CPU utilization percentages, or swap activity. PSI goes further, providing a direct metric of the “pressure” caused by contention for system resources.
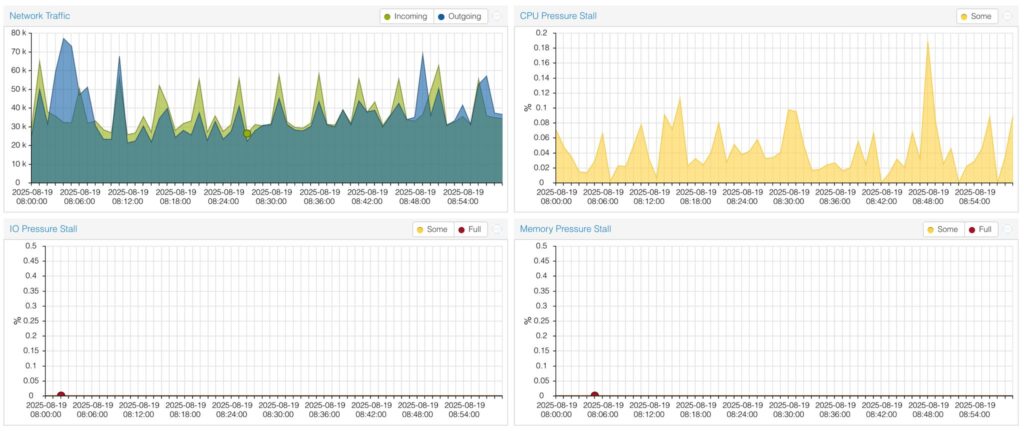
In Proxmox VE 9, PSI is integrated into the web interface, allowing users to monitor:
- CPU pressure stall: time tasks spend waiting for CPU execution.
- Memory pressure stall: time tasks spend waiting for memory pages (e.g., due to swapping or insufficient RAM).
- I/O pressure stall: time tasks spend waiting on disk or network I/O operations.
PSI vs. Traditional Metrics: A Paradigm Shift
The most common way to measure Linux system load has been the load average, which shows the number of active or waiting processes over 1, 5, and 15 minutes. However, load averages are hard to interpret in virtualized environments because they do not distinguish between CPU, memory, or I/O contention.
With PSI, the difference becomes clear:
| Metric | What It Measures | Limitations |
|---|---|---|
| Load average | Average number of active or queued processes | Doesn’t specify which resource is the bottleneck. May appear “high” even if the system is responsive. |
| CPU usage (%) | Percentage of CPU time spent executing | Doesn’t account for processes waiting for CPU cycles. |
| iostat / iotop | Disk and I/O activity metrics | Shows usage but not the impact on waiting processes. |
| PSI (CPU/Mem/I/O) | Time processes spend stalled by lack of CPU, RAM, or I/O | Direct, comparable, usable at system, cgroup, VM, or container level. |
For example: a server might show only 50% CPU usage, but PSI reveals 25% of process time is stalled on I/O. This means disks are the actual bottleneck—something that load averages would not make evident.
PSI in Proxmox VE 9
PSI integration in Proxmox VE 9 is more than just adding metrics—it’s about visibility. PSI is displayed visually for physical nodes, virtual machines, and LXC containers, thanks to cgroup support.
Key features include:
- Time windows from 1 minute to long-term historical views.
- Breakdown by resource type (CPU, memory, I/O).
- Correlation with traditional indicators like CPU, RAM, and disk usage.
Additionally, Proxmox exposes PSI values through its API, enabling seamless integration with external monitoring systems such as Prometheus, Zabbix, or Grafana.
Practical Use Cases for System Administrators
For sysadmins, PSI offers powerful insights to diagnose and prevent issues. Some typical scenarios:
1. Identifying True Bottlenecks
A node shows 50% CPU usage, but PSI reveals 25% I/O stalls. The bottleneck is storage, not CPU.
2. Cluster Resource Optimization
In clusters, a VM with high memory stalls can degrade other workloads. PSI helps admins reassign RAM, enforce limits, or migrate workloads before cluster-wide impact.
3. QoS and Cgroup Adjustments
By monitoring PSI per container, admins can pinpoint “noisy neighbors” hogging resources and apply stricter limits.
4. Early Warning During Load Spikes
PSI detects growing wait times even before crashes occur. This gives admins time to act before users notice.
5. More Realistic Benchmarking
PSI complements throughput and latency metrics, offering a fuller picture of workload performance.
Limitations and Pitfalls
As with any metric, PSI has caveats:
- Residual values during idle times: Background tasks (journaling, cron jobs) may produce non-zero PSI even on “idle” systems.
- Not a direct usage metric: PSI shows waiting time, not resource utilization. It complements, not replaces, traditional metrics.
- Context matters: A 2% stall may be harmless for batch jobs but disastrous for low-latency applications.
Cultural Impact in Sysadmin Practices
The inclusion of PSI in Proxmox VE 9 reflects a broader industry trend: moving from basic monitoring to advanced observability.
In a world of containers, microservices, and mixed workloads, knowing not just how much a resource is used, but how resource contention impacts process execution, is key.
For sysadmins, this means evolving from reactive firefighting to data-driven, proactive infrastructure management. PSI gives them the evidence to justify hardware upgrades, optimize workload placement, or negotiate SLAs with business stakeholders.
Extended FAQ for System Administrators
1. Where are PSI metrics stored in Linux?
In /proc/pressure/{cpu,memory,io}. Proxmox VE 9 reads and displays them in its dashboard.
2. What’s the difference between PSI at node and cgroup level?
Node-level PSI measures global system pressure. Cgroup-level PSI isolates pressure per VM or container, useful for identifying noisy tenants.
3. Can PSI integrate with Prometheus or Grafana?
Yes. Proxmox exposes PSI via its API. There are Prometheus exporters for /proc/pressure that enable advanced dashboards.
4. Does PSI add overhead to the host?
Minimal. The kernel implements PSI with deferred updates to minimize impact.
5. How should I interpret a 10% CPU stall?
It means that during the measurement window, processes spent 10% of the time ready to run but waiting for CPU.
6. What’s the relationship between PSI and the Linux scheduler?
PSI doesn’t alter scheduling—it observes its behavior. It helps assess whether the scheduler creates excessive queues under load.
7. Can PSI help detect abusive workloads or attacks?
Indirectly yes. Abnormally high I/O pressure in one container may indicate resource abuse or misconfigured processes.
8. What external tools complement PSI?psimon, cgroup2psi, Prometheus exporters. These leverage PSI for alerting and correlation with logs.
9. When should I worry about high PSI values?
It depends on the SLA. Sustained 5% I/O stall can be critical for web apps but tolerable for batch jobs. Always correlate with latency/response times.
10. Does PSI replace load average?
No. It complements it. Load average shows how many processes are in queue; PSI shows how long they’re stalled for.
Conclusion
The integration of pressure stall information into Proxmox VE 9 represents a major step forward in infrastructure observability. For system administrators, it provides sharper insight into bottlenecks, proactive incident prevention, and data to justify technical decisions.
In an environment where milliseconds matter, PSI changes the game: from measuring resource usage to measuring process impact. For sysadmins, that’s not just a metric—it’s a competitive edge.
Source: LinkedIN and administración de sistemas