
In the world of database administration, having powerful and accessible tools is essential to maintain system performance and stability. In this context, Dolphie emerges as a modern solution for real-time MySQL database monitoring, directly from the terminal.
What is Dolphie?
Dolphie is a TUI-based (terminal user interface) tool that provides detailed, real-time health metrics for MySQL databases. Developed in Python and leveraging the Textual framework, Dolphie combines an intuitive interface with advanced features, offering a modern and efficient alternative to tools like Innotop.
Key Features
- Graphical Interface in the Terminal
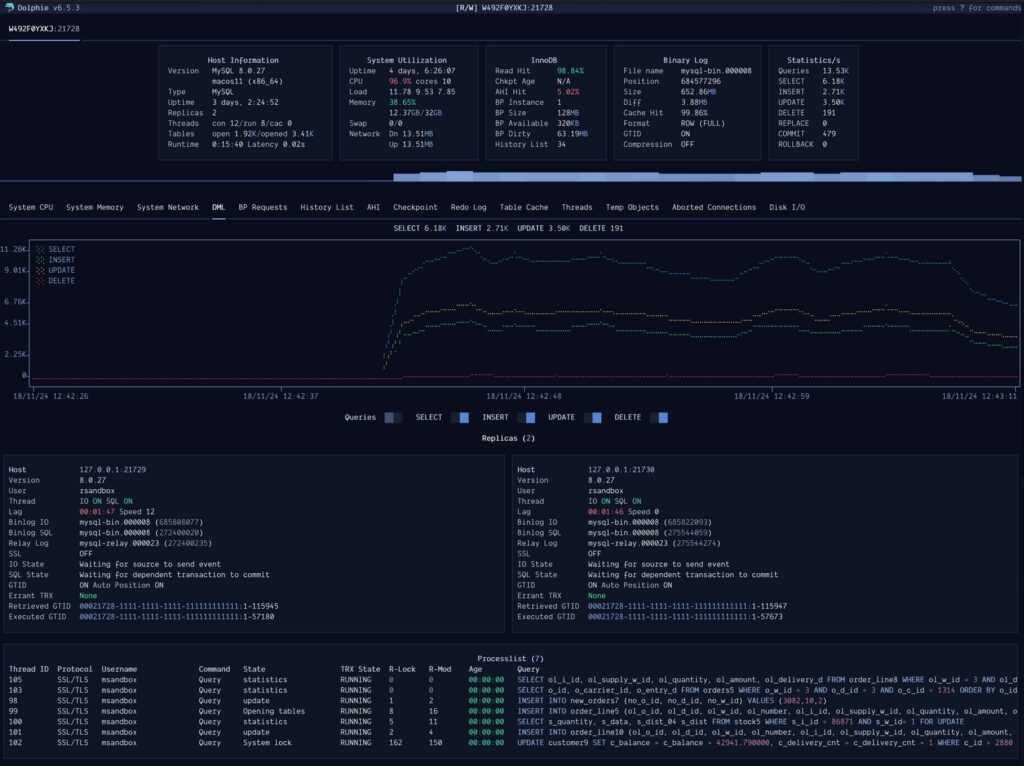
Dolphie displays key metrics such as CPU usage, memory utilization, process lists, and replication with interactive, customizable graphs directly in the terminal. - Switchable Panels
Users can toggle between four main panels:- Dashboard: A general overview of system metrics.
- Process List: Advanced thread management with options to sort, filter, or terminate processes.
- Replication: Detailed information on replicas and errant transactions.
- Graph Metrics: Visualizations of metrics like buffer pool requests, redo logs, and more.
- Support for Multiple Versions and Platforms
Dolphie supports MySQL (5.6 and above), MariaDB, and ProxySQL, along with environments like AWS RDS and Azure MySQL/MariaDB. - Session Recording and Playback
Dolphie allows users to record real-time sessions for later analysis. Data is stored in a ZSTD-compressed SQLite database, enabling playback of activity as it occurred. - Daemon Mode
Ideal for continuous monitoring, daemon mode records data in the background without displaying the graphical interface, ensuring critical information is captured during unexpected events. - Support for Encrypted Credentials
Dolphie allows managing credential profiles in its configuration file, enabling secure connections to multiple hosts. - Autocomplete Functionality
From commands to host and process names, Dolphie includes autocomplete features to streamline operations.
How Dolphie Works
When starting Dolphie, users are greeted with a main dashboard displaying key metrics, including Queries Per Second (QPS) and active process lists. From there, they can toggle graphs, filter processes, or switch between different panels as needed.
For example:
- Process Management:
Dolphie lets users filter processes by user, host, query text, or database and terminate threads directly from the interface. - Advanced Graphs:
Graphs display critical metrics like redo logs, DML operations, and replication states.
Installation
Dolphie requires Python 3.8.1 or later and can be installed using several methods:
- Homebrew:
brew install dolphie - Pip:
pip install dolphie - Docker:
Dolphie is also available as a Docker image:docker pull ghcr.io/charles-001/dolphie:latestdocker run -it ghcr.io/charles-001/dolphie:latest
Advantages Over Traditional Tools
Dolphie stands out as a modern alternative to tools like Innotop, offering integrated graphs, support for advanced terminals, and compatibility with modern MySQL and MariaDB configurations. Its modular design and multiple operation modes make it a versatile tool for database administrators.
Conclusion
With its focus on usability and modern features, Dolphie is an essential tool for any database administrator seeking a comprehensive solution for MySQL monitoring. Its ability to visualize critical metrics in real time, combined with advanced customization options, positions it as one of the best tools available today.
For more information and downloads, visit the official GitHub repository.